Flood Risk Technology, Part IV: Flood Inundation Mapping and Forecasting
This is the fourth article in a series about the evolution of flood risk technology. The series overview is here.
Over the last several months, Halff has placed a spotlight on the historical progression of technologies used to identify flood risk.
From early rainfall frequency data collection to digital mapping resources to hydrologic and hydraulic modeling innovations, we have walked through a series of tools used to protect the public and make informed, proactive decisions about flood risk.
Another piece to the puzzle gaining steam across the country is real-time forecasting for floodwater.
Residents often don’t have much reaction time to prepare or evacuate when a flood strikes, especially in smaller watersheds. But what if our communities knew with greater confidence what areas would flood during a rainfall event? What if they knew what time the flooding would occur or how deep the water would get?
That is valuable information for residents living in those areas, as well as news and weather organizations and local authorities who are trying to warn people and get them to higher ground.
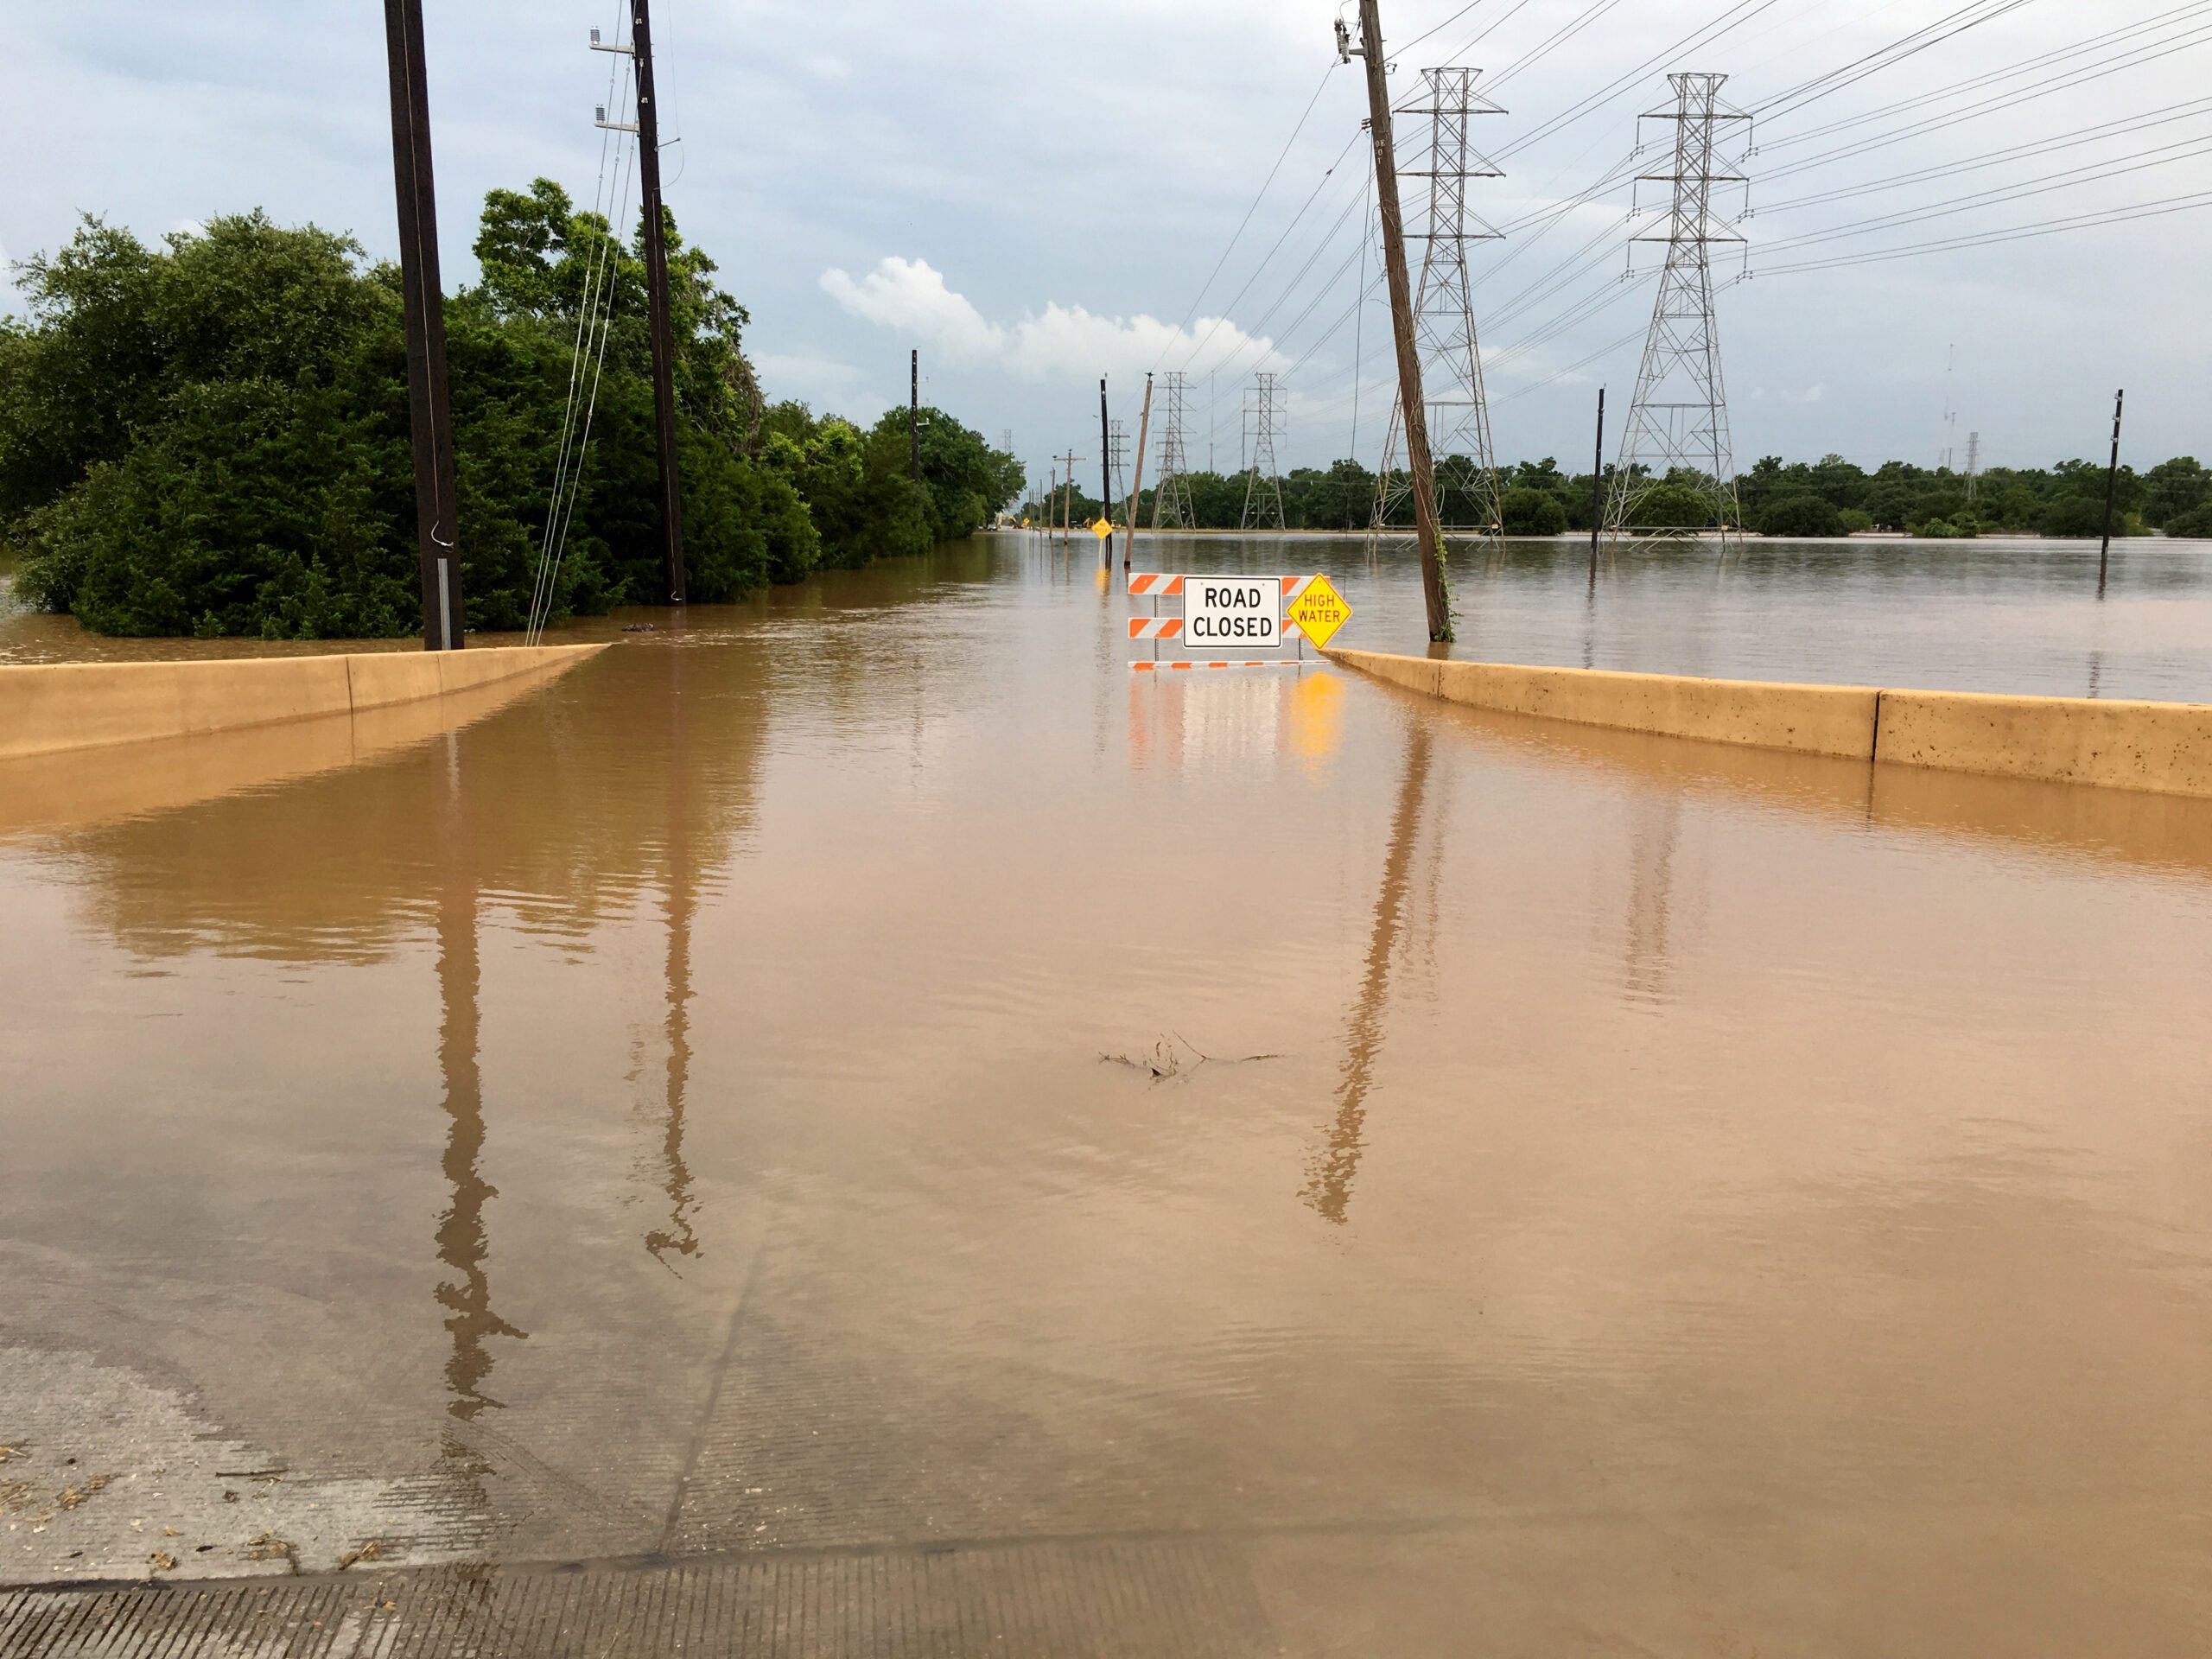
A flooded road is impassable near the Brazos River in Fort Bend County.
Painting a Picture Through Maps
There are two primary methods used today to provide that information.
Flood inundation mapping analyzes the potential of a specific event. You might think of it as a “made-up” storm event, so to speak, to understand—based on a statistical analysis of rainfall—what the resulting flood boundaries will be. Flood inundation maps are “pre-canned” assets. They might not be quite as accurate, but they can be quicker to sort through and publish in a pinch.
The other method captures an ongoing storm. Real-time forecasting provides a detailed picture of what is happening during a significant rainfall event and can identify—again through maps—what the potential inundation areas will be. The process, in a general sense, translates actual rainfall from the field into flow, places that flow into a model simulation, and eventually generates a map. This can be done every 15 or 30 minutes, for example, to provide almost immediate information.
One method produces maps based on statistics. The other collects live data and produces maps in real time. Engineers and floodplain managers are generally using the same models and topography to get either answer.
Technological advancements in areas such as LiDAR (or Light Detection and Ranging), aerial survey and computer processing have enabled the development of high-level models and better analysis of terrain. Floodplain maps continue to be refined over time as precise topography data is being captured. Thus, predictive measures for analyzing risk are more accurate.
The challenge, again, is communicating how much water is going to be in a specific location at a specific time. The average person may not comprehend the difference between 1,000 cubic feet per second and 10,000 cubic feet per second about to hit his or her neighborhood. But when that information can be translated graphically into a map, the inundation becomes a lot more meaningful.
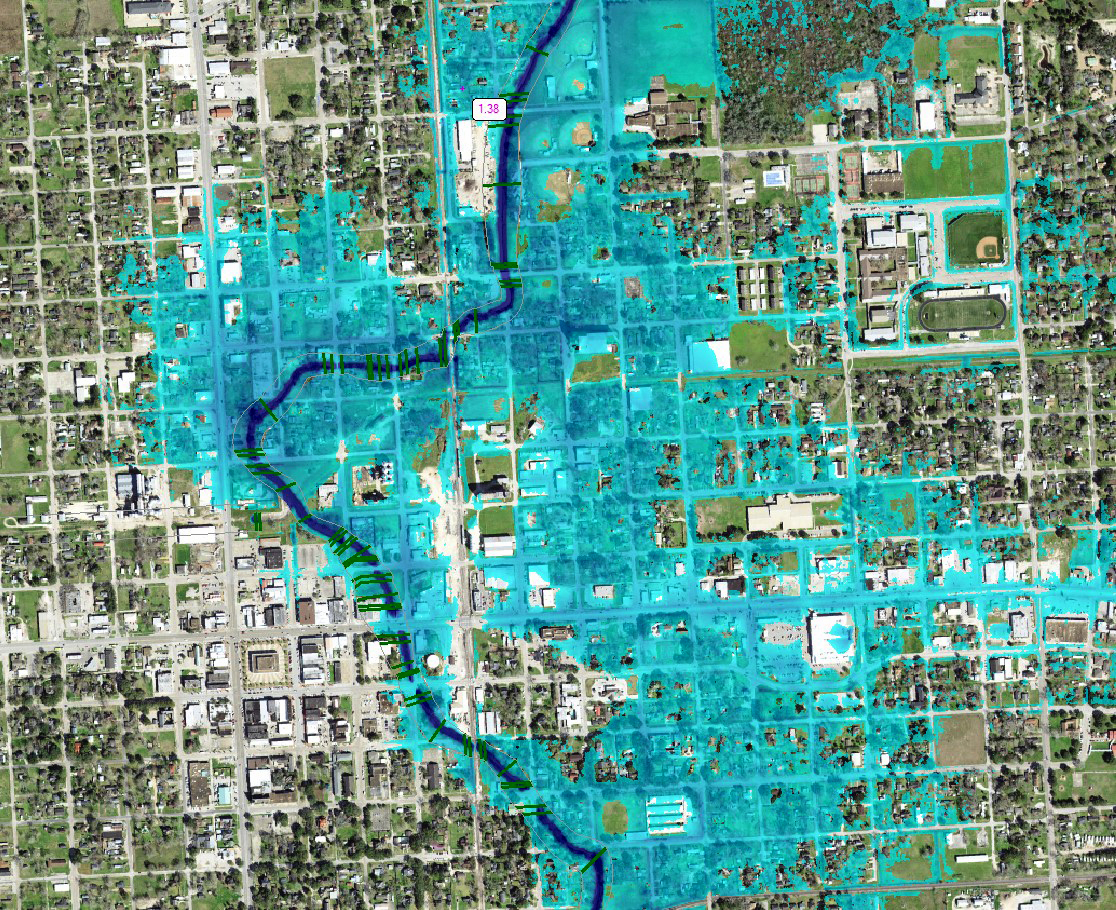
A depth aerial is an example of 2D inundation mapping.
Information in an Instant
Some semblance of a flood warning system has existed in America for well over a century by way of networks of volunteers making weather observations. Today’s smartphone and software development technology places data—the answers to the where, when and how deep questions—in the palm of your hand, instantly.
Flood warning systems are based primarily on a system of gauges scattered throughout a wide area—a county or watershed—to collect rainfall data. Sensors transmit that information to an entity such as a flood control district. It’s kept online in a user-friendly format, so anyone can take a look and observe rainfall over the last day, two days or even the last year.
Some gauges also collect water surface elevations (how high the water is getting). In the Houston area, the Harris County Flood Control District uses these gauges to warn people where water could potentially be flowing out of its banks. Reports show the location of the gauge and sensor, and they are timestamped. They provide a cross-section view showing the top of the stream bank and where the water elevation resides at the last reading. When you can see how the water gets out and where it’s going through inundation maps, it illustrates a much more accurate picture of what is happening around the county.
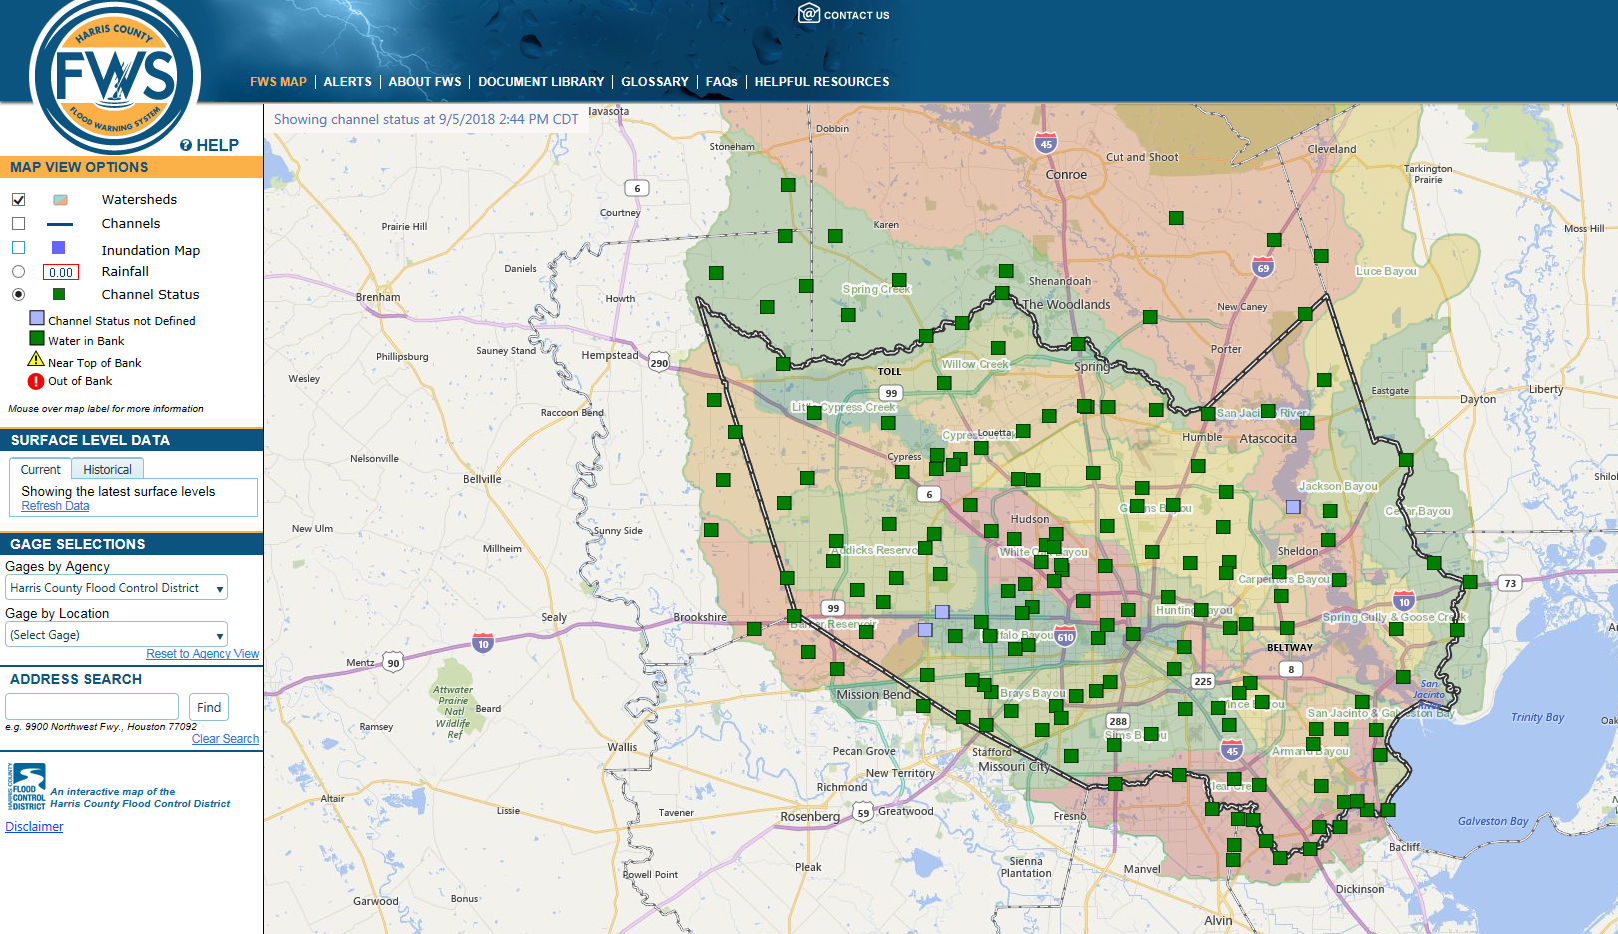
The Harris County Flood Control District produced this flood warning system website to inform residents of Harris County about potential flooding. (Courtesy Harris County Flood Control District)
Of course, there can be obstacles in managing an effective flood warning system. The information is only as good as the gauges providing data. They could be providing false information for various reasons. Therefore, maintenance is paramount.
Gauges can malfunction during heavy rainfall or get flooded out by high water. That happened during Hurricane Harvey in multiple locations. Most of the time, you can’t go on site and verify the condition of a gauge. One way to keep an eye on it is by installing a camera where possible. That allows for a visual on the gauge and the deteriorating conditions outside.
Computations can also fail if models are not calibrated to, or validated by, actual events. The model could be overpredicting potential flooding, for example.
Hurricane Harvey pushed the HCFCD to do more to warn and protect citizens. This is the direction flood warning is going. While other counties and states, such as Iowa, provide robust flood warning systems, they are few in number.
People who do have the wherewithal, along with news agencies and other organizations, have a place to go to pull priceless information.
For more information about flood risk technology or Halff’s Water Resources team, write to Info-Water@Halff.com.
Recent Stories

Halff Receives ACEC Florida FDOT Outstanding Project Award
CRESTVIEW, Fla. — The SR 30 Pedestrian Underpass at the Inlet Beach project was presented with the Outstanding Project Award in…

How Resilience Planning Helps Communities Adapt and Strengthen
Resilience planning has become a critical focus in response to today’s unprecedented environmental challenges and billion-dollar climate disasters, which demand…