Flood Risk Technology, Part II: Historical Rainfall Records
This is the second article in a series about the evolution of flood risk technology. The series overview is here.
Hurricanes Harvey, Irma and Maria have altered parts of Texas, Florida and the Caribbean forever. As a result, new criteria and standards for flood control/stormwater features are being examined closely.
Many state and government agencies are trying to factor rainfall variability into the design of future projects—a tall order because predicting rainfall is not an easy endeavor.
For example, Harris County in South Texas has adopted some of the highest standards of floodplain management criteria in the nation after enduring Harvey last August. Harris County is using the 500-year flood elevation—plus 2 feet—as a requirement for building new homes in flood-prone, unincorporated areas.
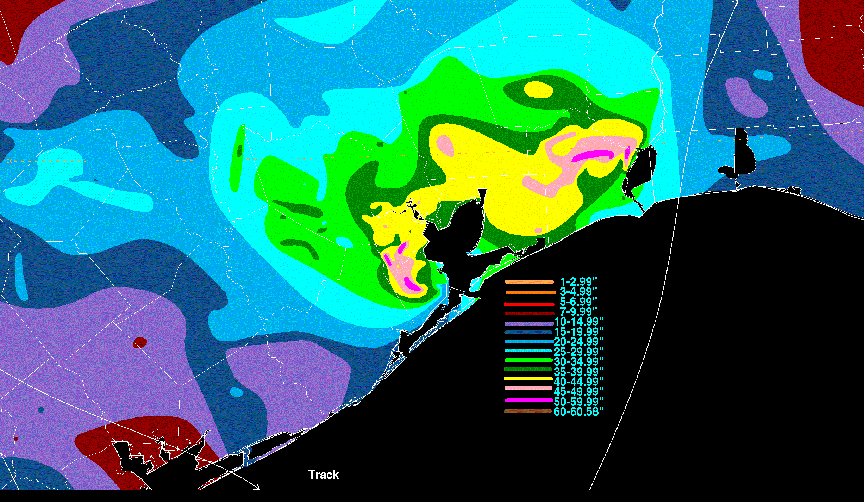
This map shows rainfall totals for Southeast Texas recorded during Hurricane Harvey in August 2017. (NOAA)
Flood hazard maps in use today generally rely on historical rainfall data that is entered into statistical modeling programs and used to develop standardized precipitation predictions.
Rainfall has been measured and recorded for hundreds of years. And one of the most important tools used for the planning and design of water resources engineering projects is the intensity-duration-frequency (IDF) curve, a graphical representation of the probability that a given average rainfall intensity will occur.
This is the backbone for all hydrologic and hydraulic work that has been done to identify floodplains as we know them today.
Following are highlights of how historical rainfall records have evolved over the last century.
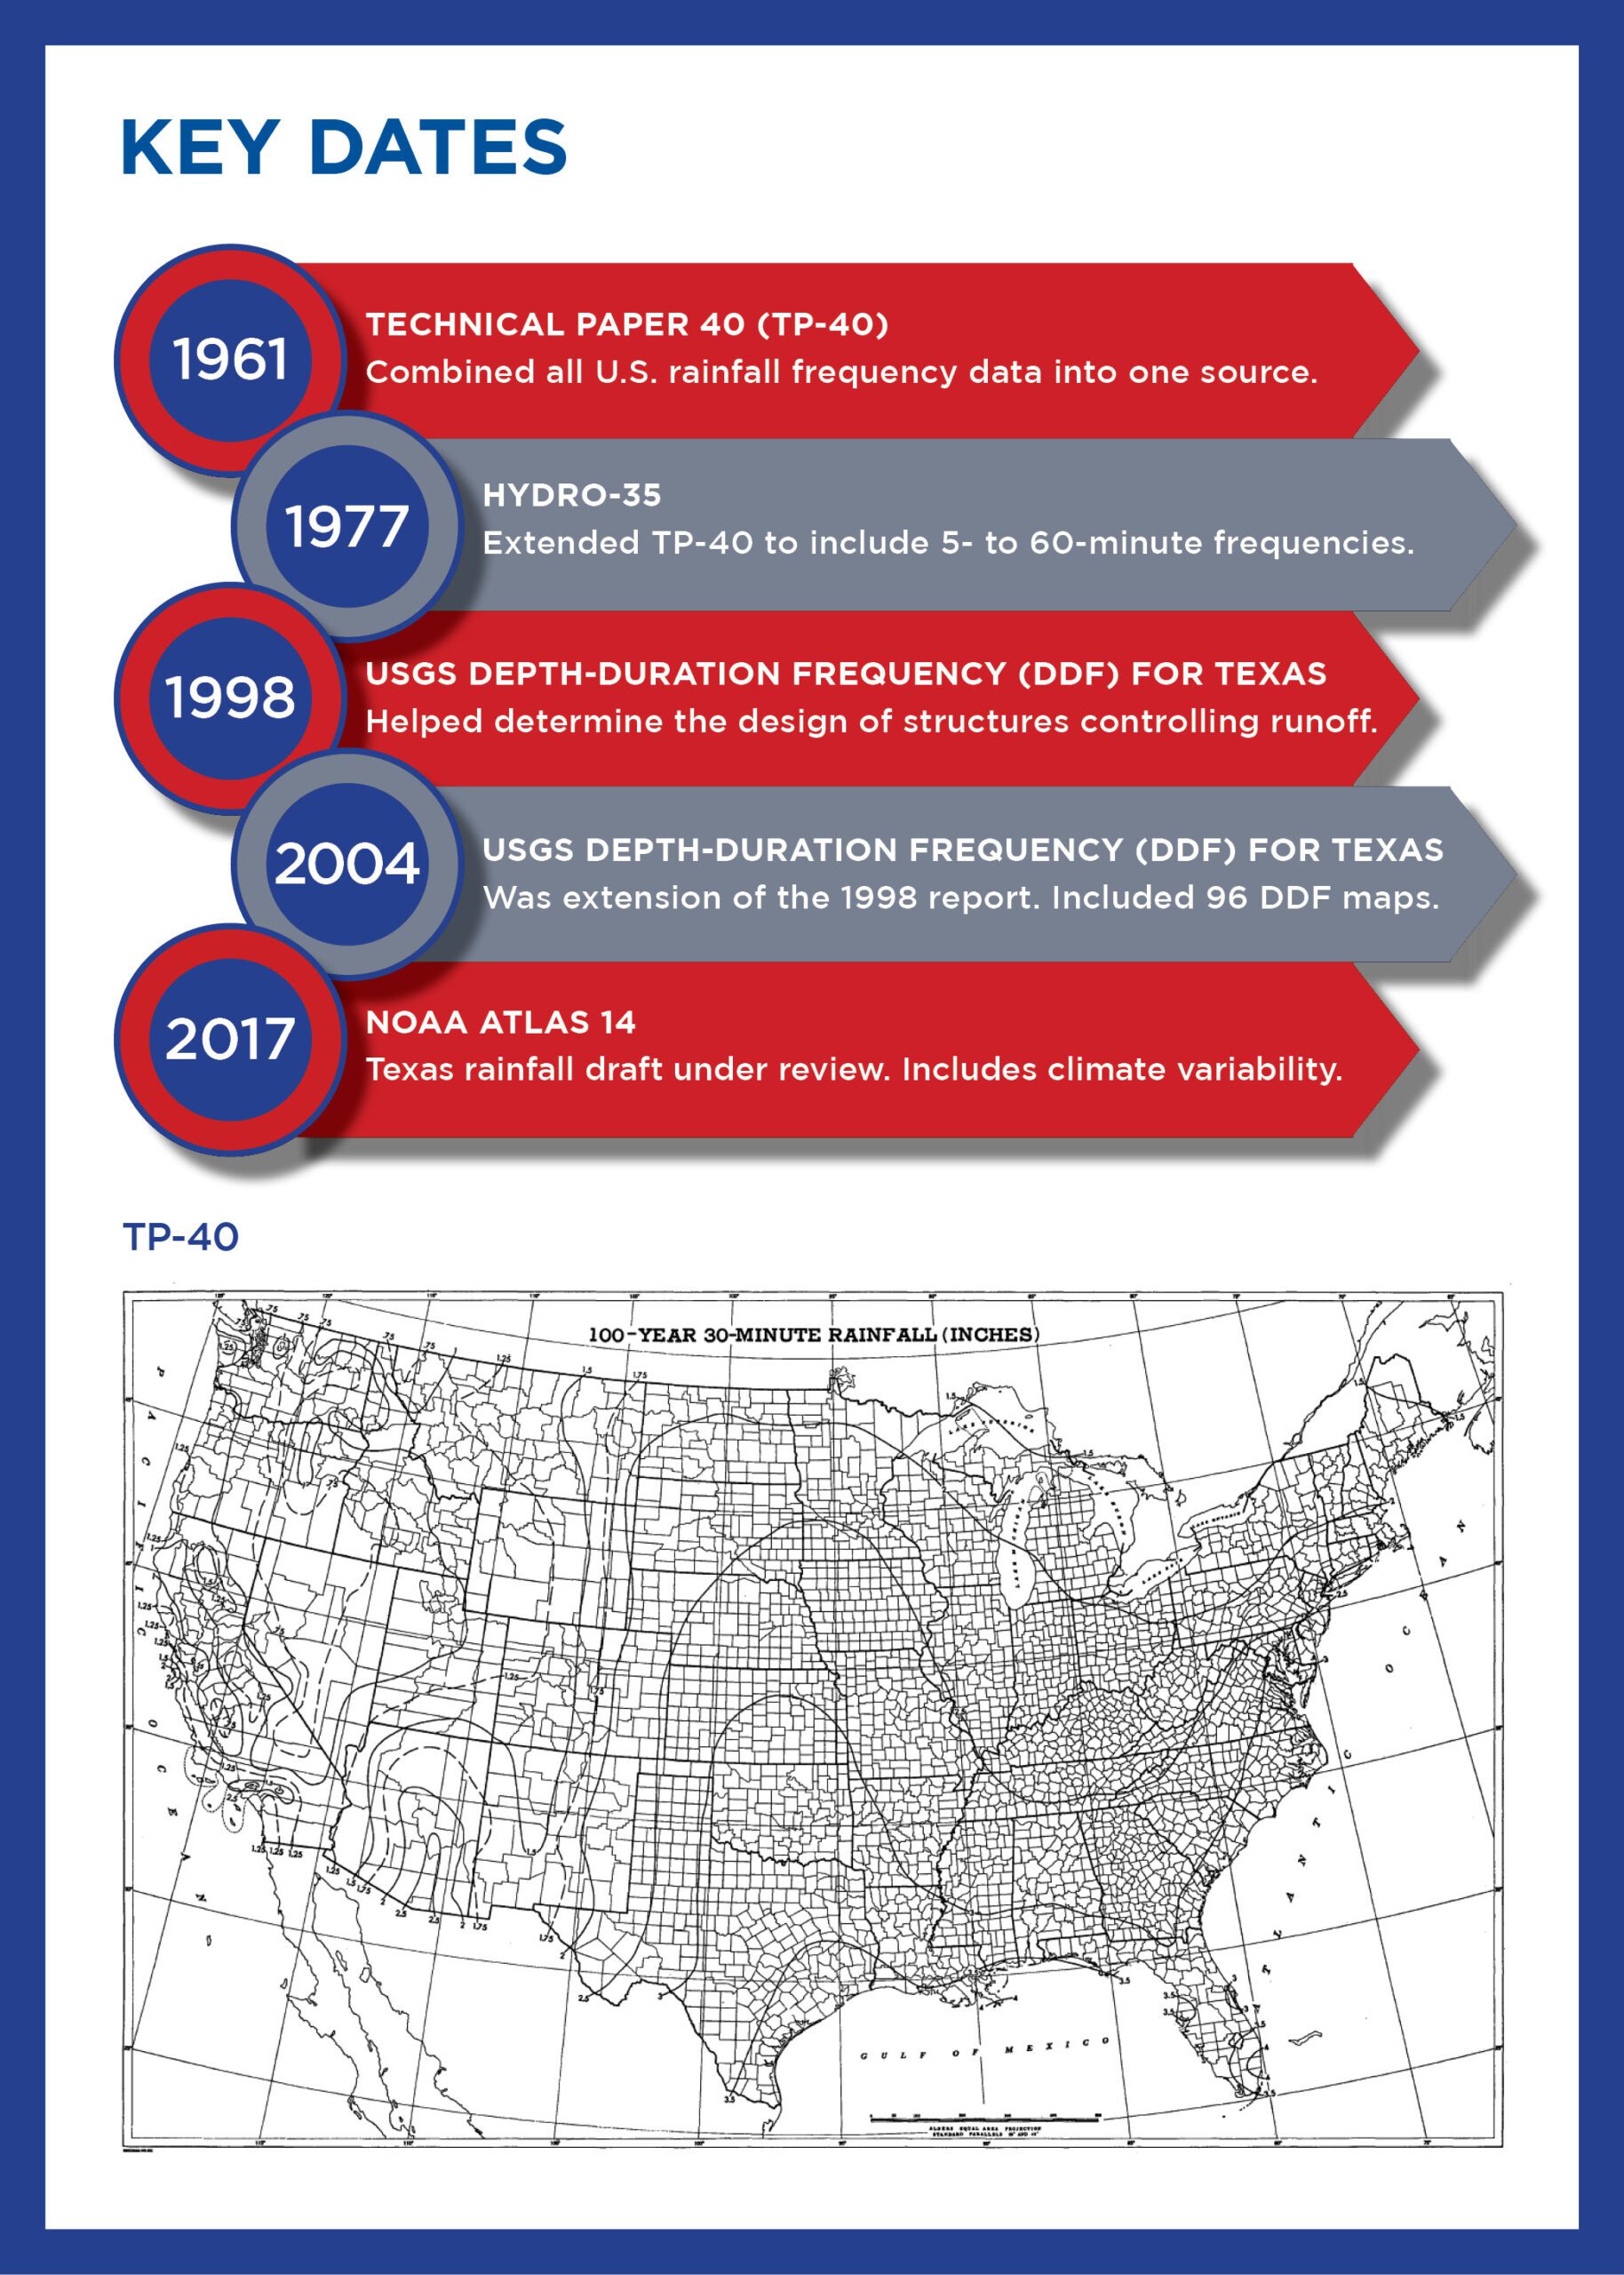
TP-40. The U.S. Weather Bureau began producing IDF curve reports for various parts of the country in the 1950s. Those reports were based on rainfall data collected from the early 1900s to about 1948. The big breakthrough came in 1961, when Technical Paper 40 was published as the Weather Bureau, in cooperation with the Soil Conservation Service, attempted to define the “depth-area-duration-frequency regime” of the United States. TP-40 was an offshoot of many previous Weather Bureau publications and combined all rainfall frequency data into one source—and it covered the entire nation. It was the go-to rainfall frequency atlas that covered durations from 30 minutes to 24 hours, and return periods from one to 100 years. TP-40 proved to have staying power—it is still used by many communities today.
HYDRO-35. The National Weather Service’s Office of Hydrology produced HYDRO-35 in 1977. It extended the TP-40 report to include five- to 60-minute precipitation frequencies at return periods of two to 100 years for the Eastern and Central United States (37 states from North Dakota to Texas and eastward). Engineers often use the two reports together.
Depth-Duration Frequency of Precipitation for Texas. The U.S. Geological Survey, in conjunction with the Texas Department of Transportation, prepared a new study in 1998 of the depth-duration frequency of precipitation in Texas. It included TP-40 data, plus nearly 40 additional years of rainfall records, and provided more sophisticated data. Six years later, in 2004, the USGS released an extension of the 1998 report.
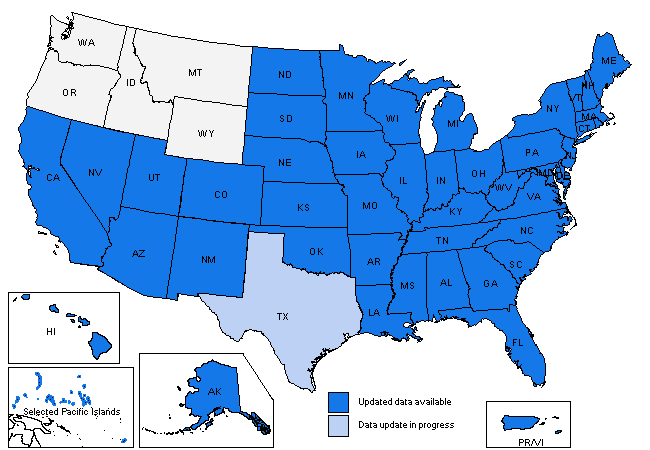
NOAA has released the Texas volume of Atlas 14, which is now under review. (NOAA)
NOAA Atlas 14. In 2004, 43 years after TP-40 was published, the National Oceanic and Atmospheric Administration (NOAA) released the first volume of its precipitation-frequency atlas of the United States. It examined states in the Southwest. The most recent volume, which is under peer review now, is Volume 11 and focuses on Texas. Atlas 14 could be revolutionary for Texas because the potential effects of climate variability were also examined. A portion of the Texas draft was reconfigured recently to include data from the Wimberley floods of 2015 and the Hurricane Harvey flooding of 2017. Texas is one of the last states to get an entry into Atlas 14, and there could be dramatic changes in terms of how future floodplains are defined because of the changing rainfall. The impact of Atlas 14 will be substantial to some Texas locations, whereas today’s 500-year floodplain could become the new 100-year floodplain. Atlas 14 also uses a point-and-click web portal to conveniently distribute precipitation frequency estimates and supplementary products.
What does all this mean?
The earliest rainfall frequency data was derived from about 200 Weather Bureau stations spread across the nation. Today, there are more than 8,600 National Weather Service rainfall gauges that are recording throughout the United States. Incorporating the best rainfall data into engineering assessments of flood risk enables us to create better designs and programs to mitigate that risk.
Floods are difficult to predict. However, analyzing historical data and creating more accurate assessments of flood hazard will result in more effective solutions that allow cities and communities to make smarter decisions and help keep their residents safe.
For more information about flood risk technology or Halff’s Water Resources team, write to Info-Water@Halff.com.
Recent Stories

The Man Behind the Momentum: A Q&A With Halff’s Atlanta Operations Manager Randy Strunk
Randy Strunk is Halff’s Atlanta operations manager, leading efforts to expand the firm’s new office in the region. Randy Strunk has…

Inside Halff: A Look at May 2026
Halff projects earned national recognition for engineering excellence, while the firm was honored for its impact on communities and the…