How GIS Is an Effective Tool in Evaluating Environmental Impacts and Accelerating the Decision-Making Process
Halff’s scientists and planners rely on Geographic Information Systems (GIS) to develop layers of important geospatial and environmental data for project planning and development. GIS technology streamlines the analyses and documentation necessary to ensure our clients’ projects are compliant with environmental laws.
By utilizing GIS, we can quickly gather and organize data, map important features and quantify impacts to determine regulatory permitting requirements. GIS data is also easily converted and referenced directly into MicroStation files, allowing our engineers to view constraints alongside evolving project design alternatives to avoid and minimize environmental impacts. GIS and DGN (CAD extension) file sharing between environmental specialists and engineers/architects promotes efficiency and ensures impact analyses are consistent with the latest design plans as project development progresses.
Halff mobilizes field teams to create GIS data using GPS handheld devices to efficiently pinpoint and delineate critical environmental features. Tablets linked to external GPS receivers can also be used in the field to input data in a digital format. This and other technology such as project-tracking dashboards allow real-time tracking so project managers and technical experts can review and analyze data as it is collected. It also eliminates conversion of handwritten forms and field notes.
Here are some specific ways GIS is implemented to accelerate the environmental process:
-
Preliminary threatened and endangered species evaluations are performed by reviewing GIS data for critical habitat, the Texas Parks and Wildlife Department’s county list and Natural Diversity Database, and U.S. Fish and Wildlife Service Information for Planning and Consultation (IPaC) data. GIS shapefiles of potential habitat are then assembled based on high-resolution aerials, TPWD’s Ecological Mapping Systems of Texas (EMST) maps, soil survey and topographical data. This also enables targeting areas for field surveys completed later to verify habitat and presence of species.
-
Desktop delineation of potential waters of the United States (below), including wetlands, is performed using digital elevation models, i.e., U.S. Geological Survey LiDAR, along with stream centerlines from the National Hydrography Dataset, National Wetlands Inventory mapped features, hydric soil units and recent aerial photography to digitize features and provide context for avoiding and minimizing impacts early. Data can be developed quickly for broad study areas for flexibility in evaluating design alternatives.

-
GIS data, including demographics and information from desktop research/windshield surveys for GIS mapping of community features such as schools, places of worship and parks/recreation areas, is used to characterize the community impacts for a NEPA project area, avoid impacts to sensitive or vulnerable populations or tailor a public outreach approach.
-
Halff uses GIS to save time building traffic noise analysis models that accurately reflect real-world geometry for transportation improvement projects.
-
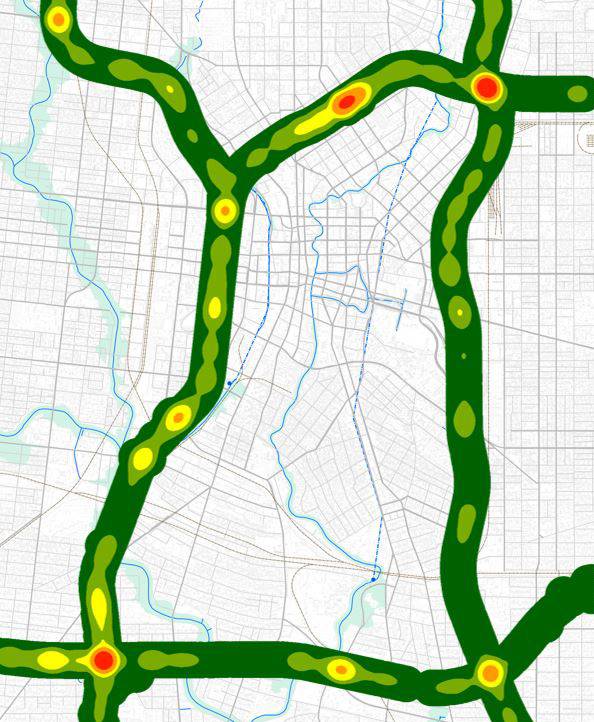
Hot spot analysis of incidents (below)—data such as air quality pollutants or vehicle crashes—can be performed and mapped. This information helps a project decision-maker easily see where problems occur and find solutions.
-
For public involvement events, GIS landowner data from appraisal districts is exported for use in developing mailing lists and maps of property owners adjacent to projects for public meeting notices and right-of-entry requests.
-
GIS data is used to evaluate cultural resource impacts for a project area. Downloaded information from government agencies and data from field surveys for buildings, objects and districts listed or eligible for the National Register of Historic Places (NRHP), plus historical markers, State Antiquities Landmarks and previously recorded or newly discovered archeological sites are mapped to avoid/minimize potential impacts and assist in determining mitigation, if necessary, on projects with federal funding or agency involvement.
-
GIS land and property data from appraisal districts is used in conjunction with proposed right of way data for linear projects such as roadways and utilities to efficiently and reliably estimate the cost of right of way acquisition.
-
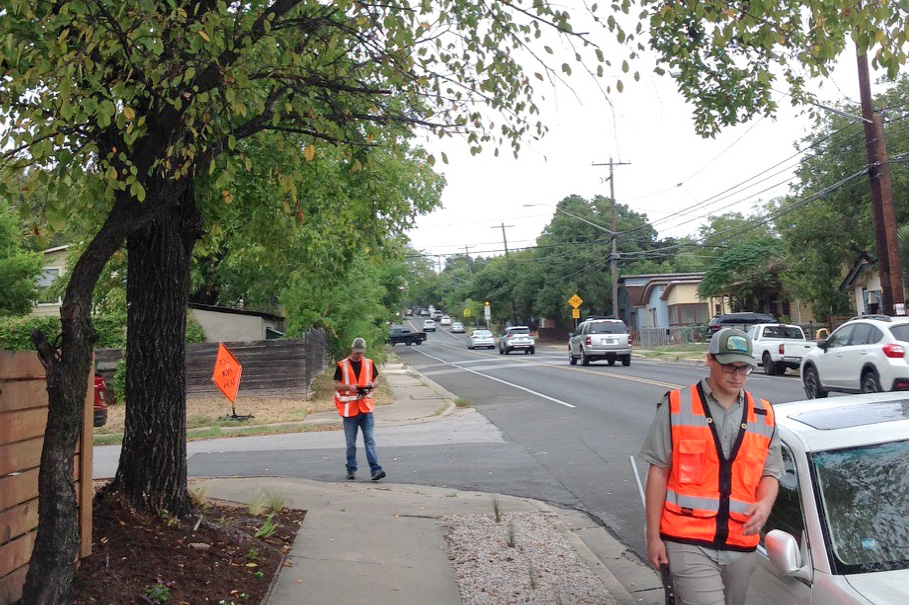
Tree inventory data (below) is stored and mapped to help municipalities better understand their urban forest. The GIS component provides a framework for more proactive management of green infrastructure assets.

These examples show how GIS is being used on a daily basis as an effective tool on a variety of land development, transportation, public works, water resources, utilities, oil and gas, architecture and landscape architecture projects by Halff’s core environmental services including environmental due diligence, remediation and compliance, natural and cultural resources, and National Environmental Policy Act (NEPA) studies.
Write to Info-Environmental@Halff.com to see how Halff can find a solution for you.
Recent Stories

Halff’s Jenny LaFoy Receives Prestigious TSPE Engineer of the Year Award
RICHARDSON, Texas — Halff’s Associate Vice President and Project Advisor Jennifer “Jenny” LaFoy, PE, CFM, ENV SP, has been named…

TFMA Technical Summit | Aug. 26-29, 2025
Come see Halff at the 2025 TFMA Technical Summit taking place August 26 – 29, 2025, in San Antonio, Texas,…