
Data From Central Texas Floods Tells a Story We Can’t Ignore
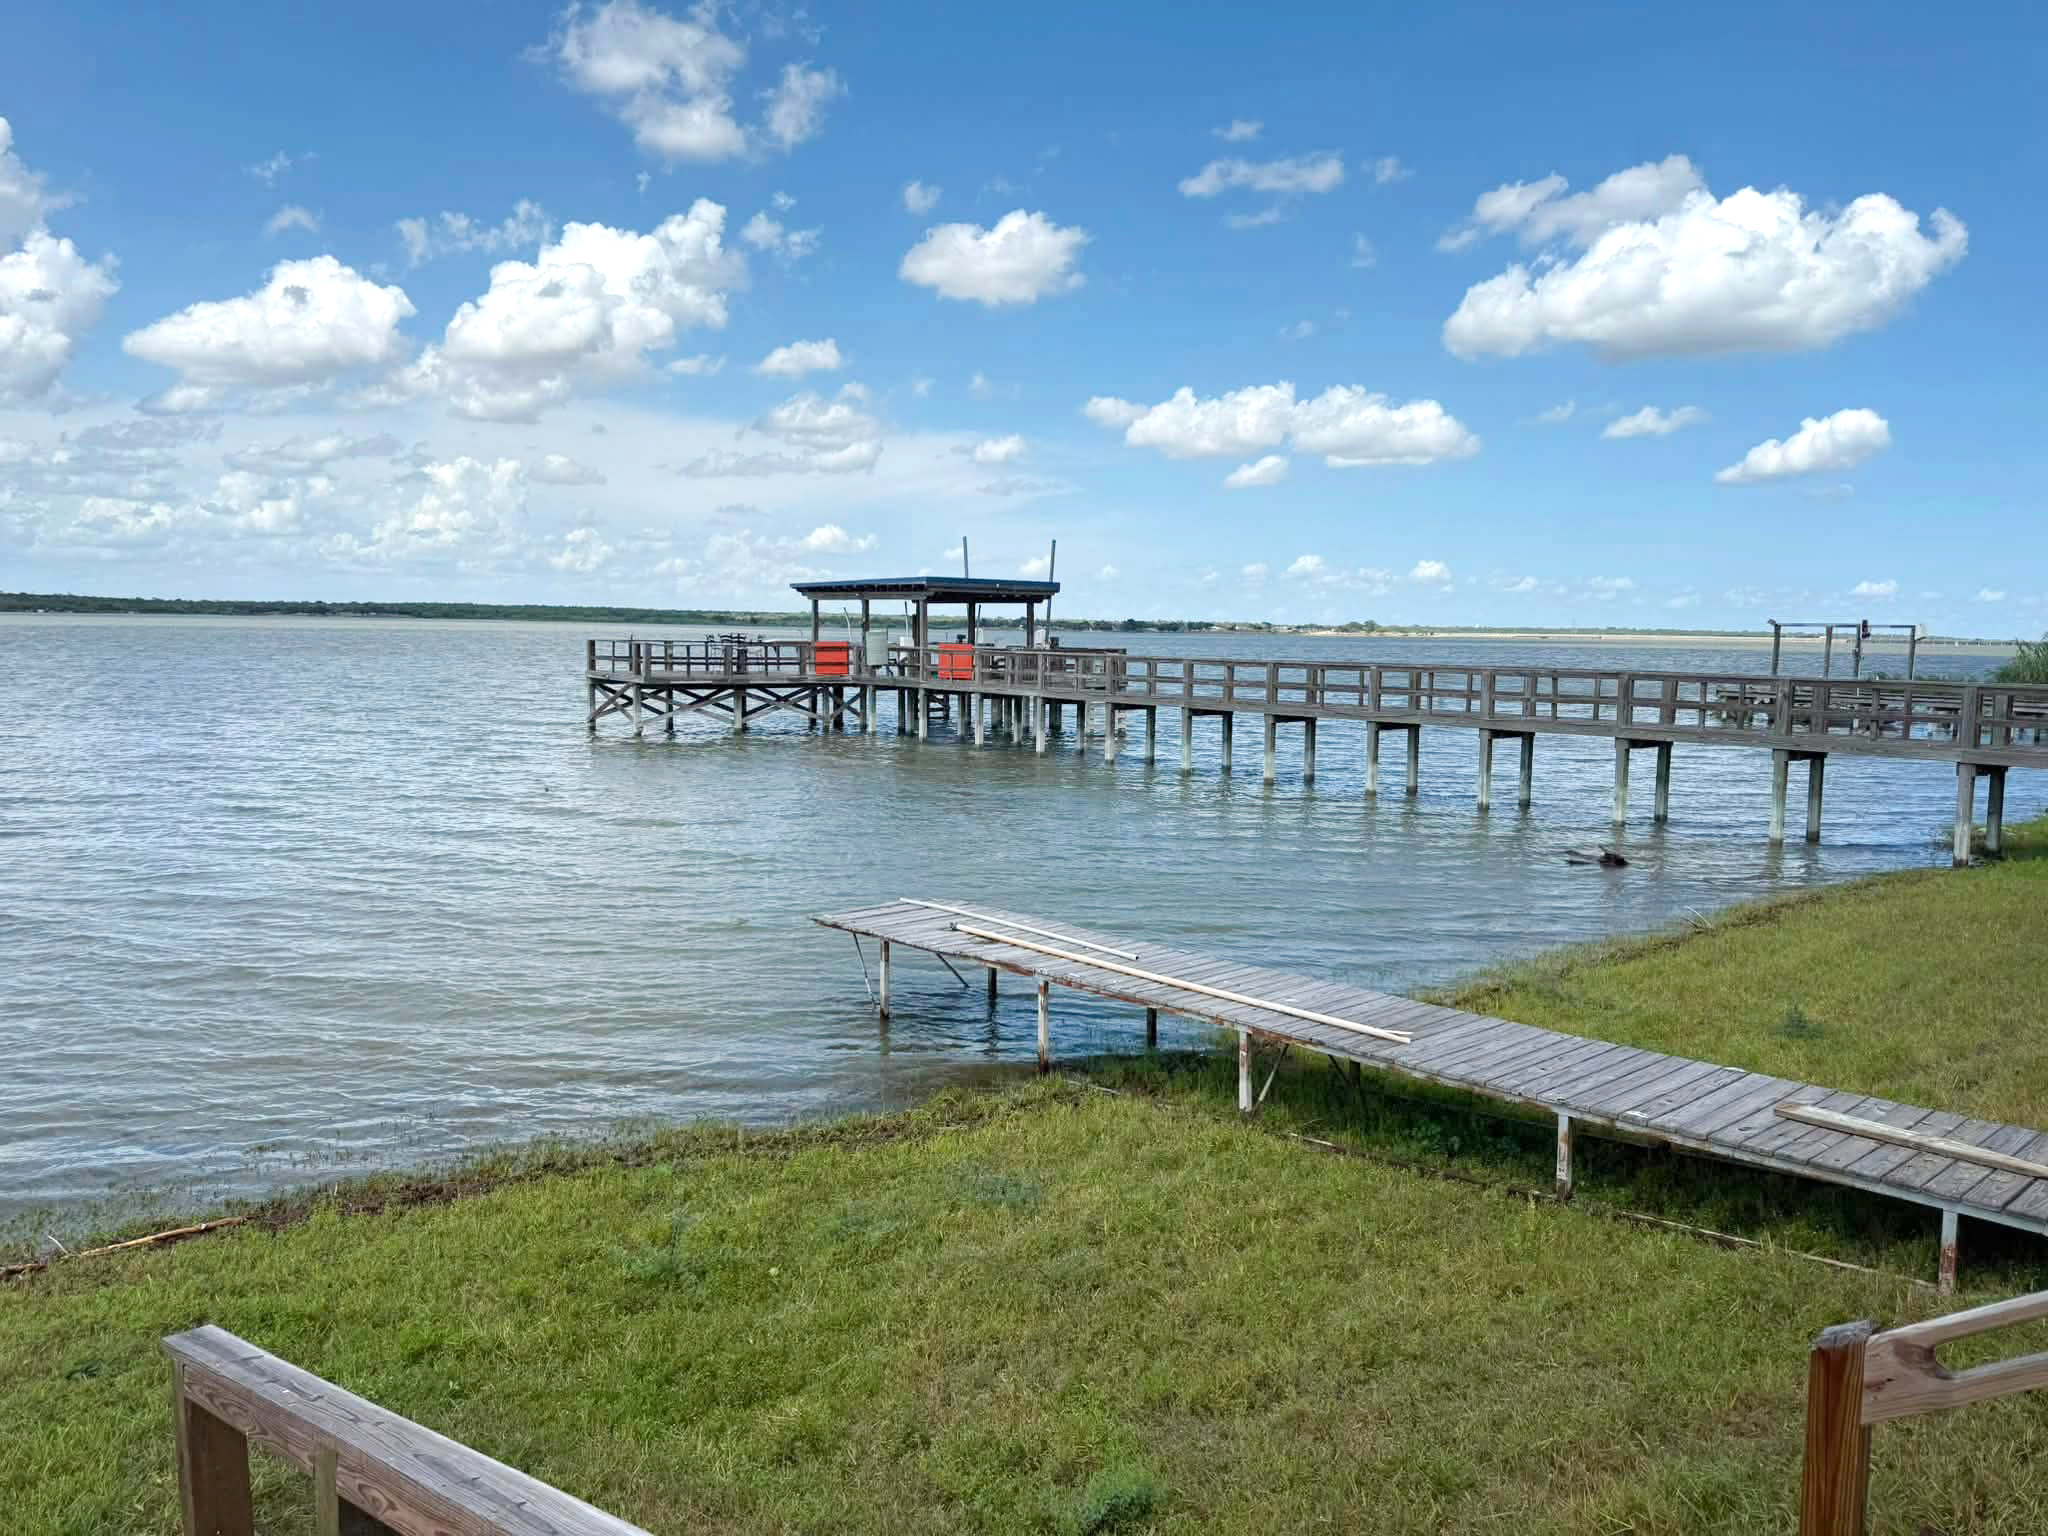 Lake Corpus Christi, previously only 11% full before the storm, became 92% full from the stormwater runoff. Photo courtesy of Nueces County Commissioner Mike Pulsey (Aug. 7, 2026).
At a Glance
When floodwaters hit Central Texas in July of 2026, it didn’t just mark the second consecutive year of significant flooding in the region. It underscored another important reality: understanding what happened is just as important as responding to it.
Residents, community leaders and emergency managers were left asking critical questions. Why were some areas impacted more severely? How did this event compare to previous floods?
Flood data holds many of those answers. It is one of the most powerful tools we have to protect communities from future floods. Part of helping communities in the aftermath means looking at the story the data tells us.
That’s why Halff’s team analyzed the July 2026 storm to translate existing flood model data into a clearer picture of what happened, where it happened and why it matters.
This data is useful because the same body of information serves a multitude of purposes. Emergency managers, local leaders, floodplain managers and communities can surface different pieces of information that answer their questions, inform response and recovery, and guide future infrastructure investment.
Learning from the last storm’s data is how we properly prepare for the next one.
What’s Different About the July 2026 Floods?
The July 2026 storm unfolded over a longer period than the previous year’s major flood event. While the 2025 flood occurred over two days, rainfall in 2026 began on July 13 and continued for five days.
Pockets of intense rainfall across Central Texas left widespread flooding across 59 counties, leading to road closures, rapid river rises, water rescues and significant impacts to homes, businesses and infrastructure. While every flood event is different, the July 2026 storm illustrates how duration, location and intensity work together to shape conditions on the ground.
Those distinctions matter. A regional total can show the scale of a storm, but local and statewide stakeholders need more specific answers: Where was the rainfall most intense? How rare was it? Which areas experienced the highest flood stages?
That breakdown of information is of utmost importance for communities. Emergency managers may need to identify the streets, homes and facilities most likely affected. Local leaders may need to explain the event’s magnitude to residents, councils or boards. Floodplain managers may compare observed conditions with mapped risk. While flood analysis is important to warn people of danger, it can also be used by water supply planners to follow where the runoff traveled and how it can reach storage.
Flood Analysis: Rainfall Observations and Flood Map Data
High-level volumes illustrate the storm’s sheer scale, but capturing its true impact requires a closer look at several layers of information:
• Where the rain fell
• How long it lasted
• How intense it was
• How rare the event was
• What rainfall frequency it represented
To measure flood risk and design flood infrastructure, experts rely on the National Oceanic and Atmospheric Administration’s (NOAA) Atlas 14. For Texas, it provides point precipitation frequency estimates in a given year across the state. Atlas 14 updates showed that places like Austin and Houston receive more rainfall in a “100-year storm” than previously thought.
For the July 2026 event, Halff assessed post-event rainfall using gridded hourly precipitation from the Multi-Radar/Multi-Sensor Quantitative Precipitation Estimation dataset. With gage bias correction applied, the dataset offered the best available gridded rainfall information for an immediate post-event review. Halff compared rainfall accumulations across multiple durations with NOAA Atlas 14 estimates to evaluate the storm’s rarity, severity and spatial distribution.
This translation is what makes the data more usable. Mapping that total against frequency estimates shows where 25-, 50-, 100- or 1,000-year thresholds were approached or exceeded. That context can support briefings to elected leaders, comparisons with floodplain maps and conversations about where additional study or investment may be warranted.
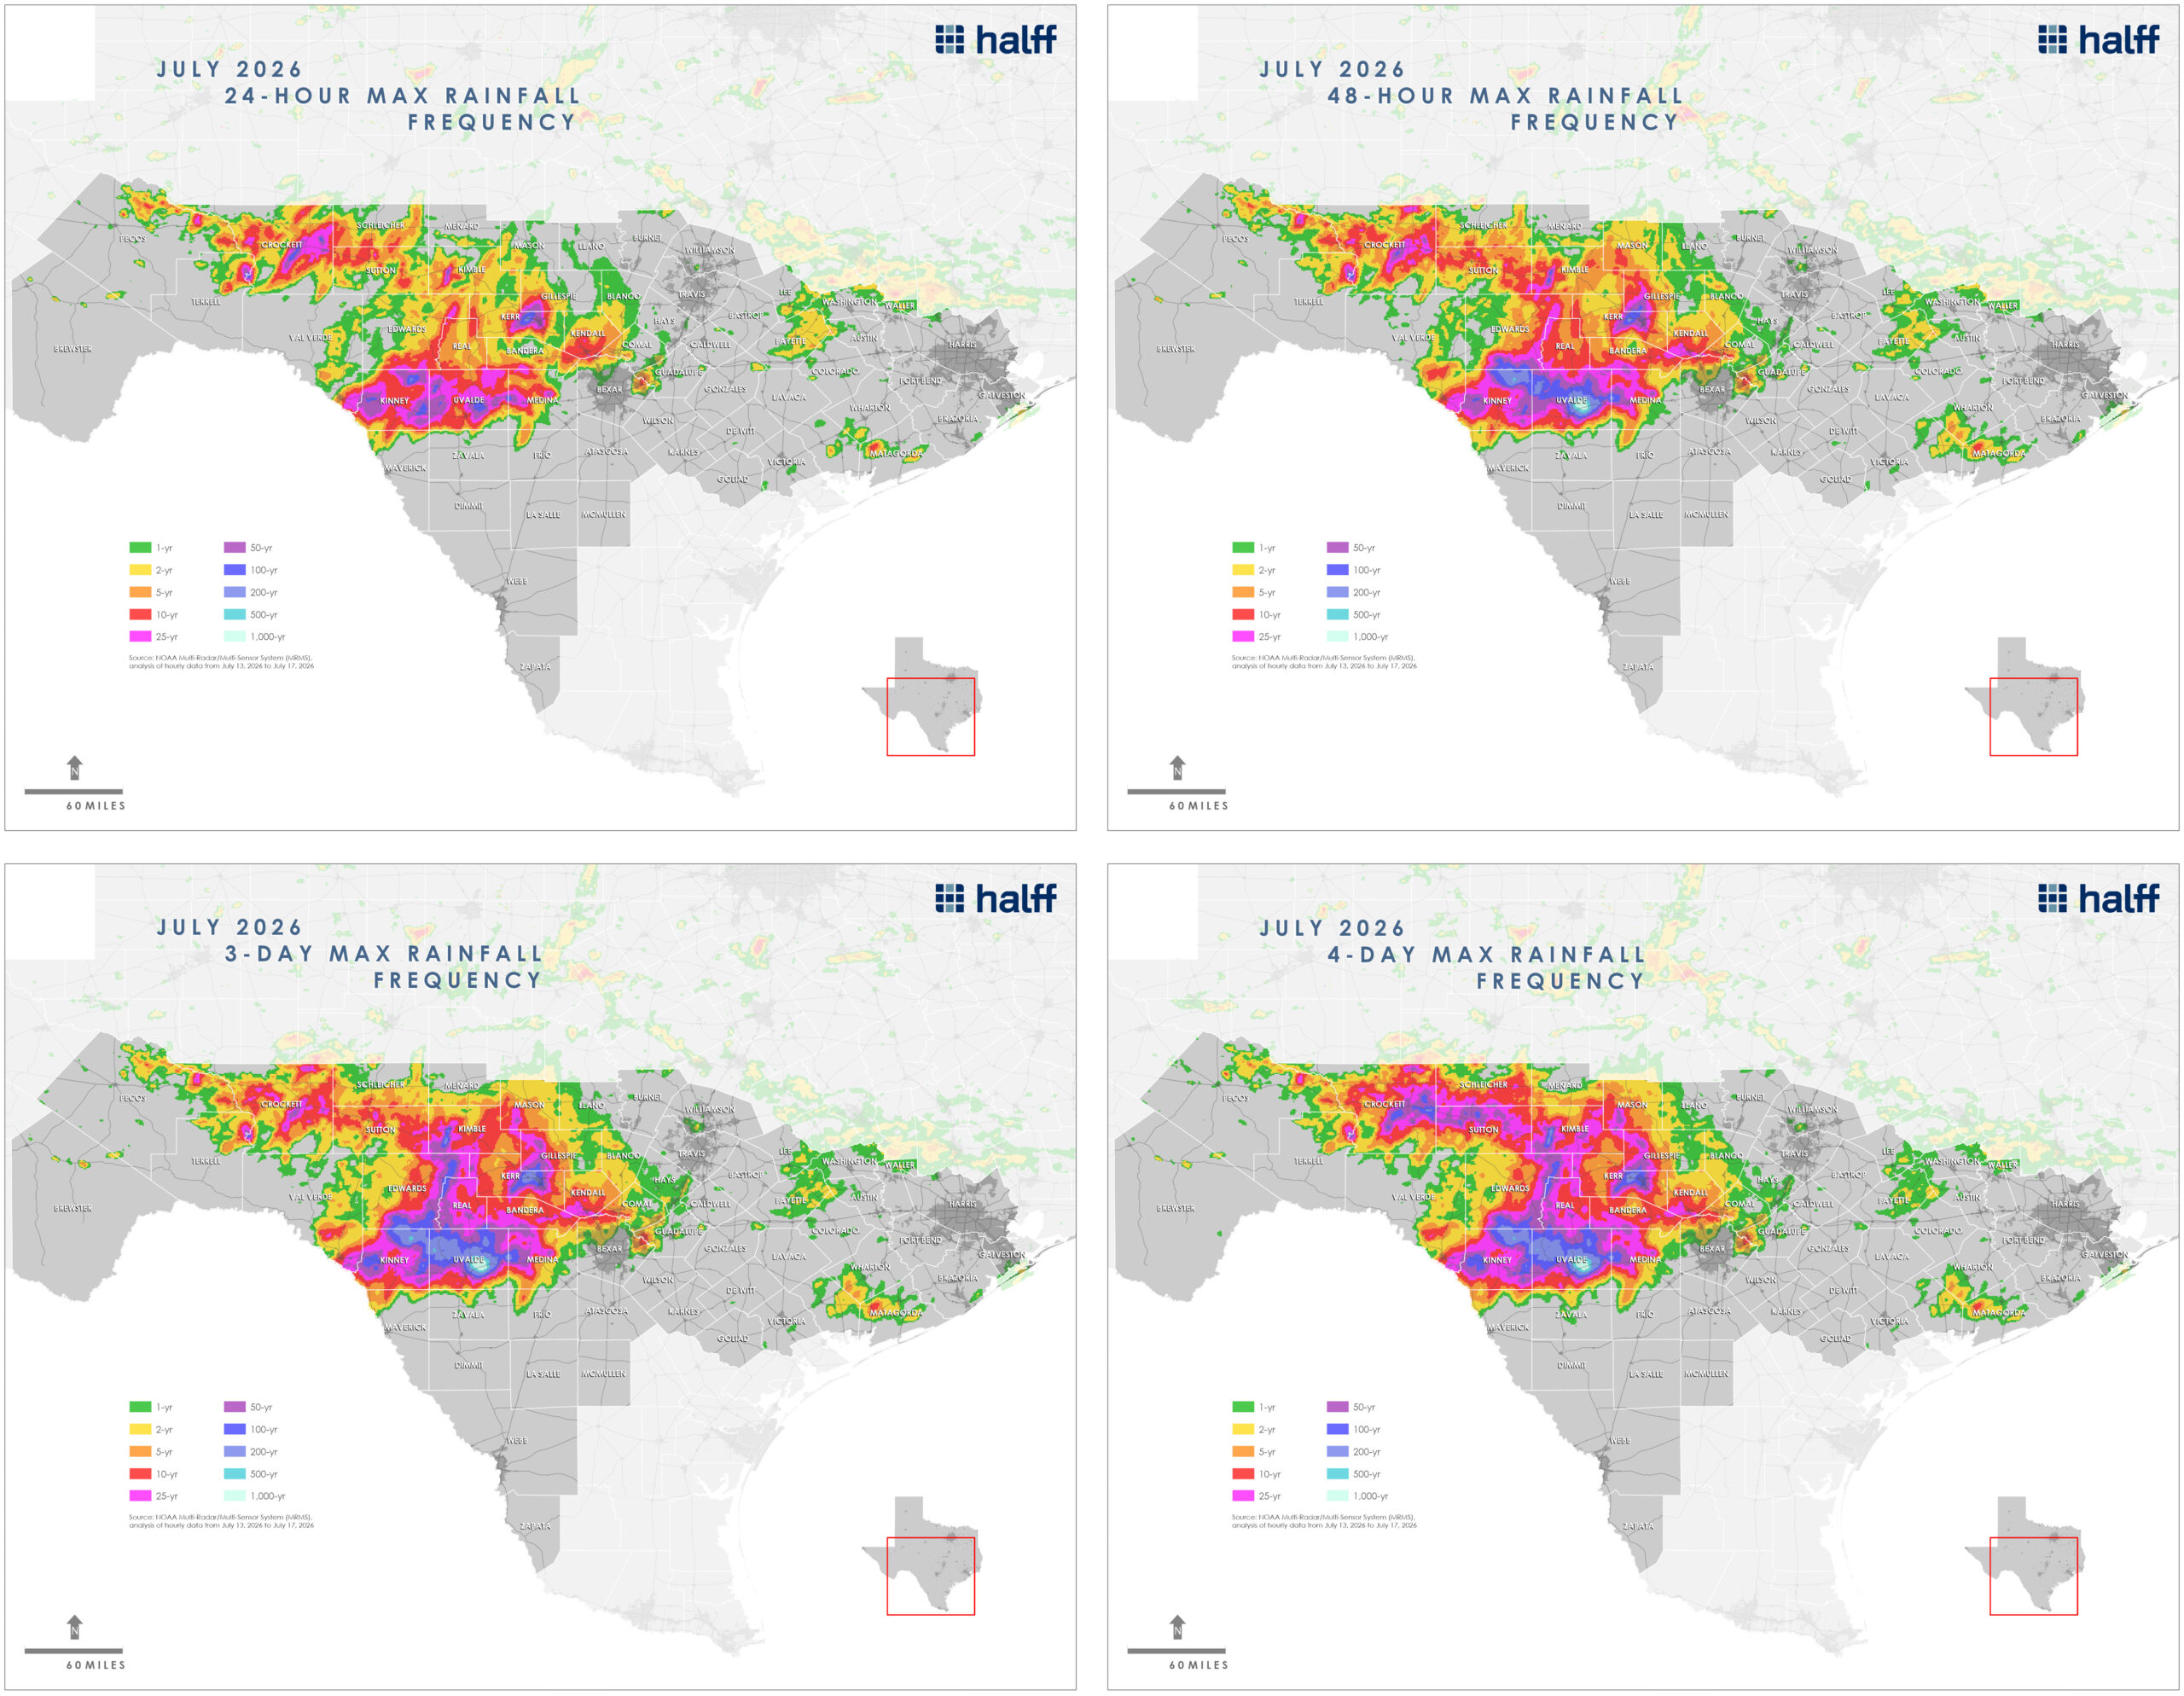
Maximum 24-hour, 48-hour, 3-day and 4-day rainfall frequencies for the disaster-declared counties.
Looking across multiple durations helps distinguish a short, intense cloudburst from a prolonged event. That difference can matter when communities examine how drainage systems performed, compare the storm with design assumptions or communicate why impacts varied across neighboring areas.
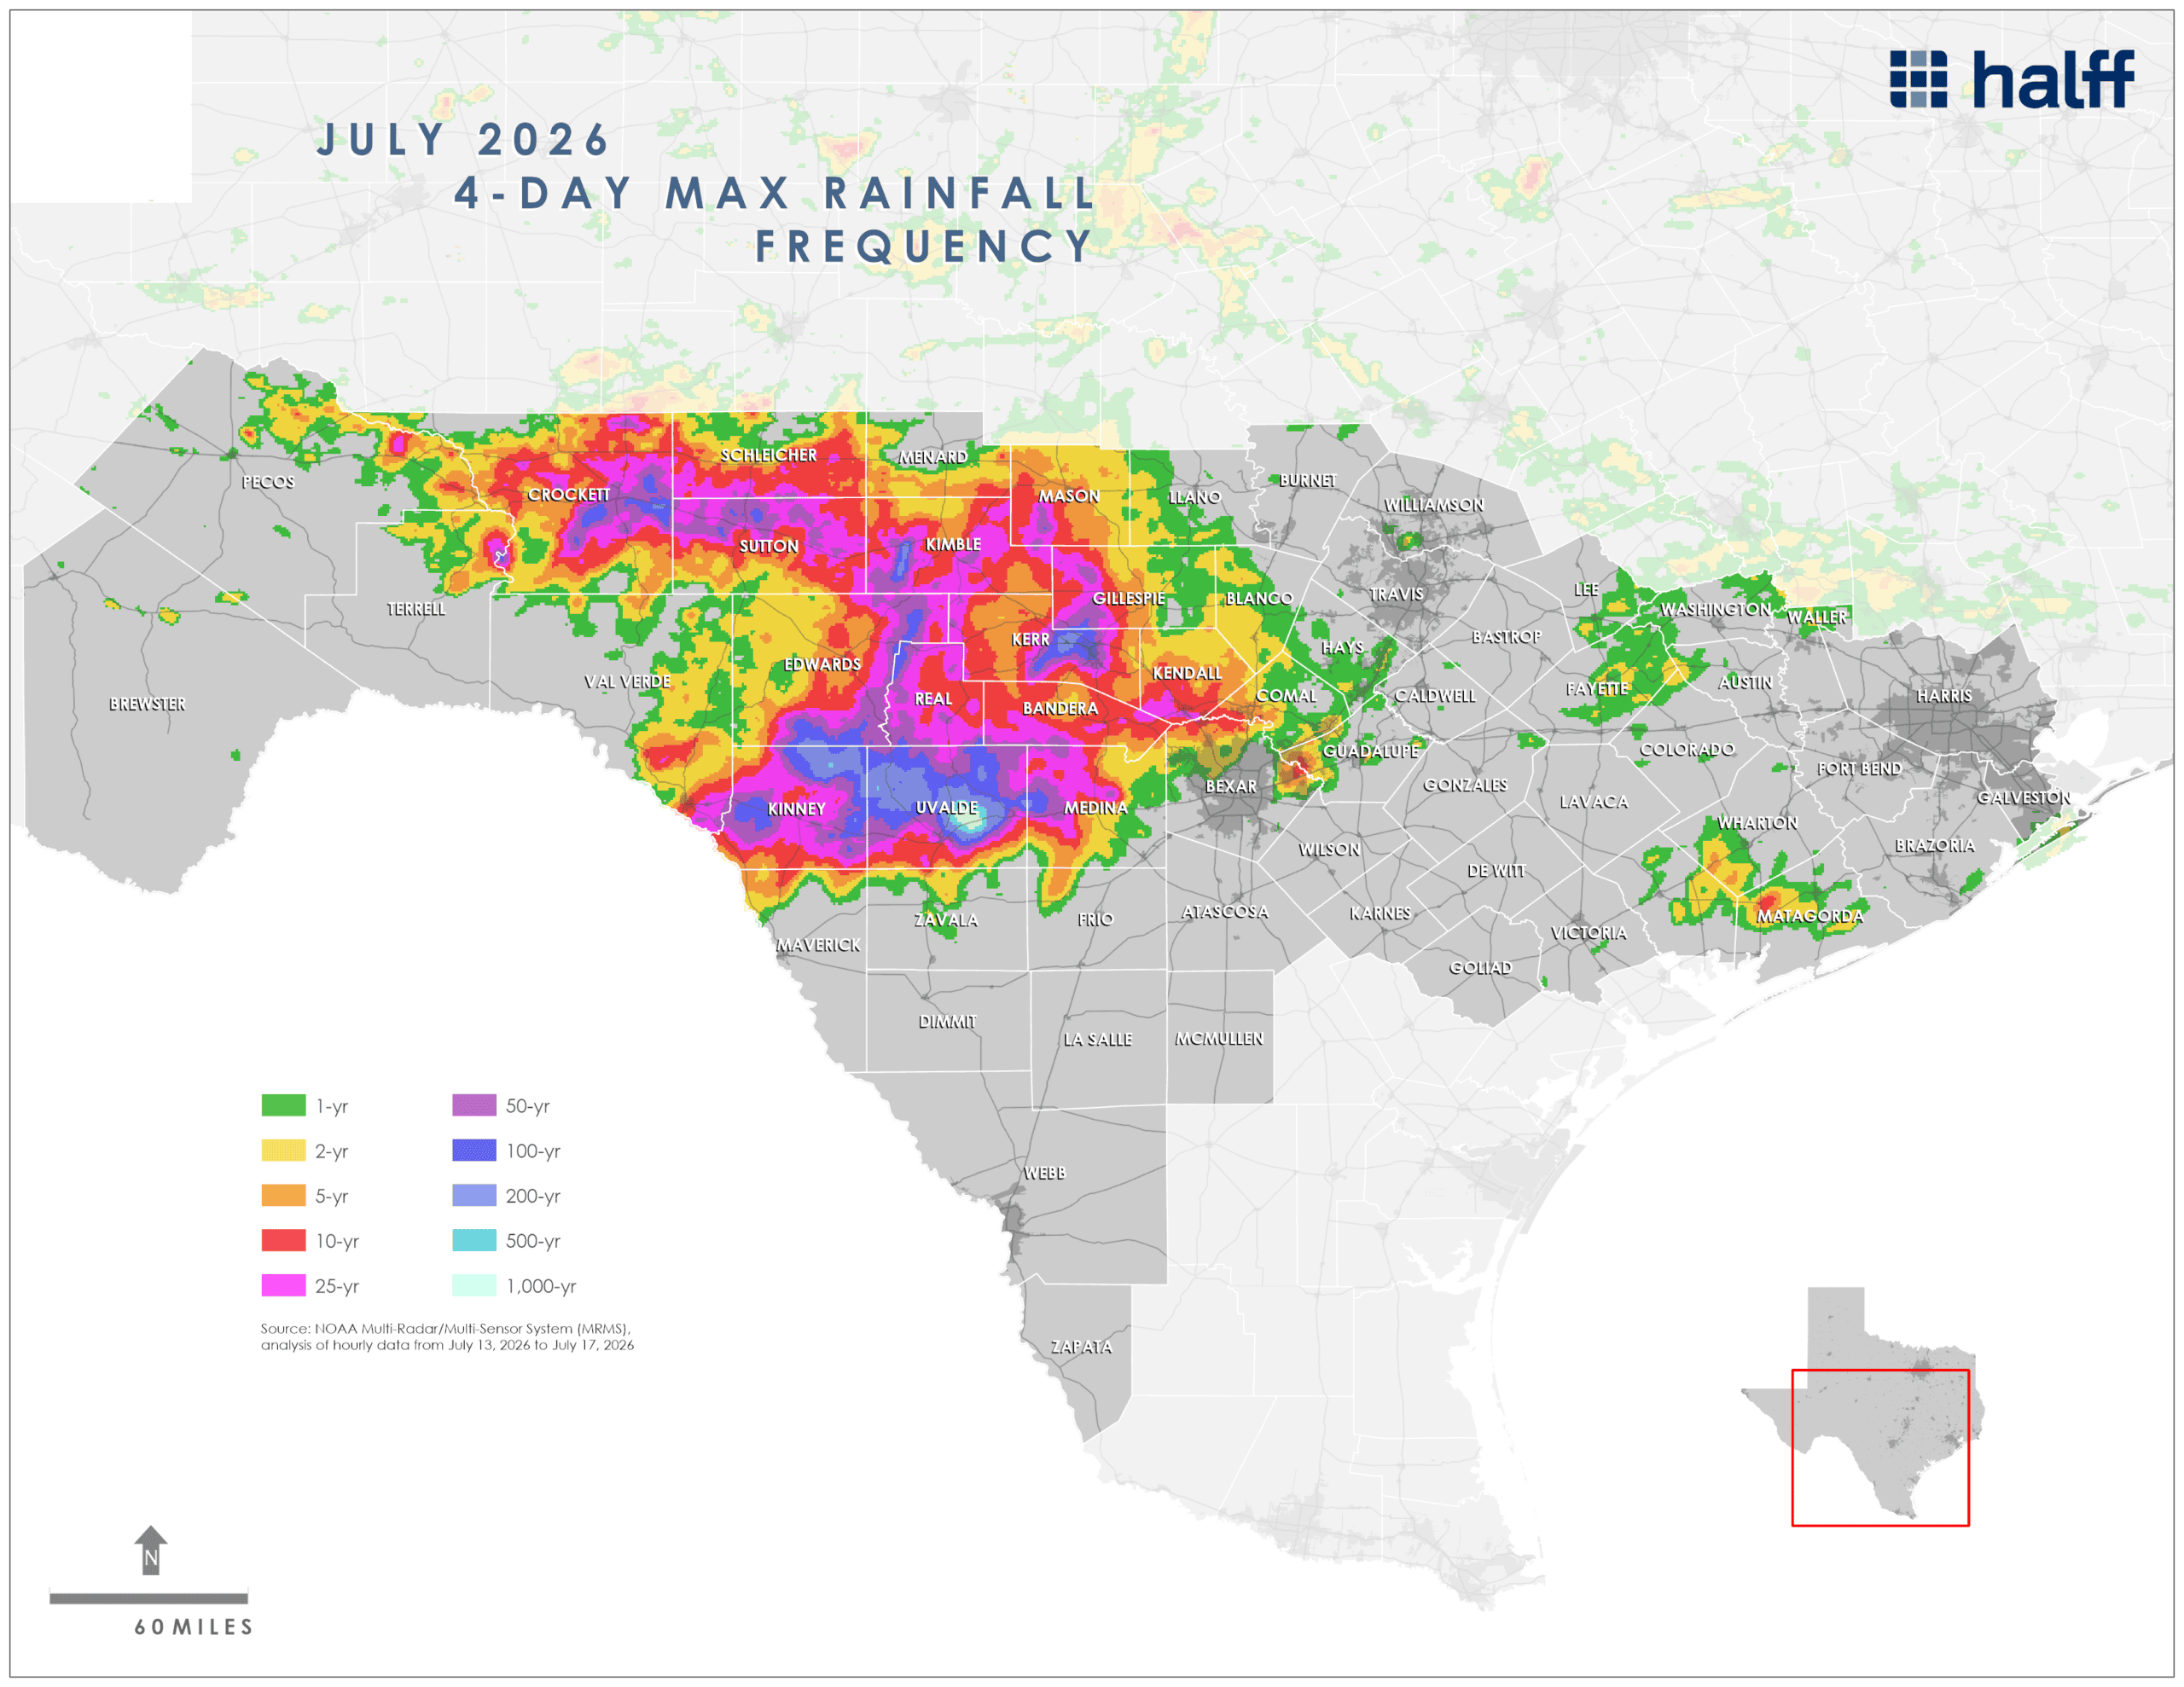
Up close, you can see the extreme magnitude in purple/blue and how the 4-day rainfall frequency spread further and reached a 100 to 1,000-year event status, particularly in Uvalde County.
Comparison of the two, three and four-day rainfall accumulations to Atlas 14 frequency estimates indicates that a much broader portion of the state-declared disaster area experienced exceptionally high rainfall over a prolonged period. In particular, south-central Uvalde County experienced rainfall totals that approached or exceeded the 1,000-year event.
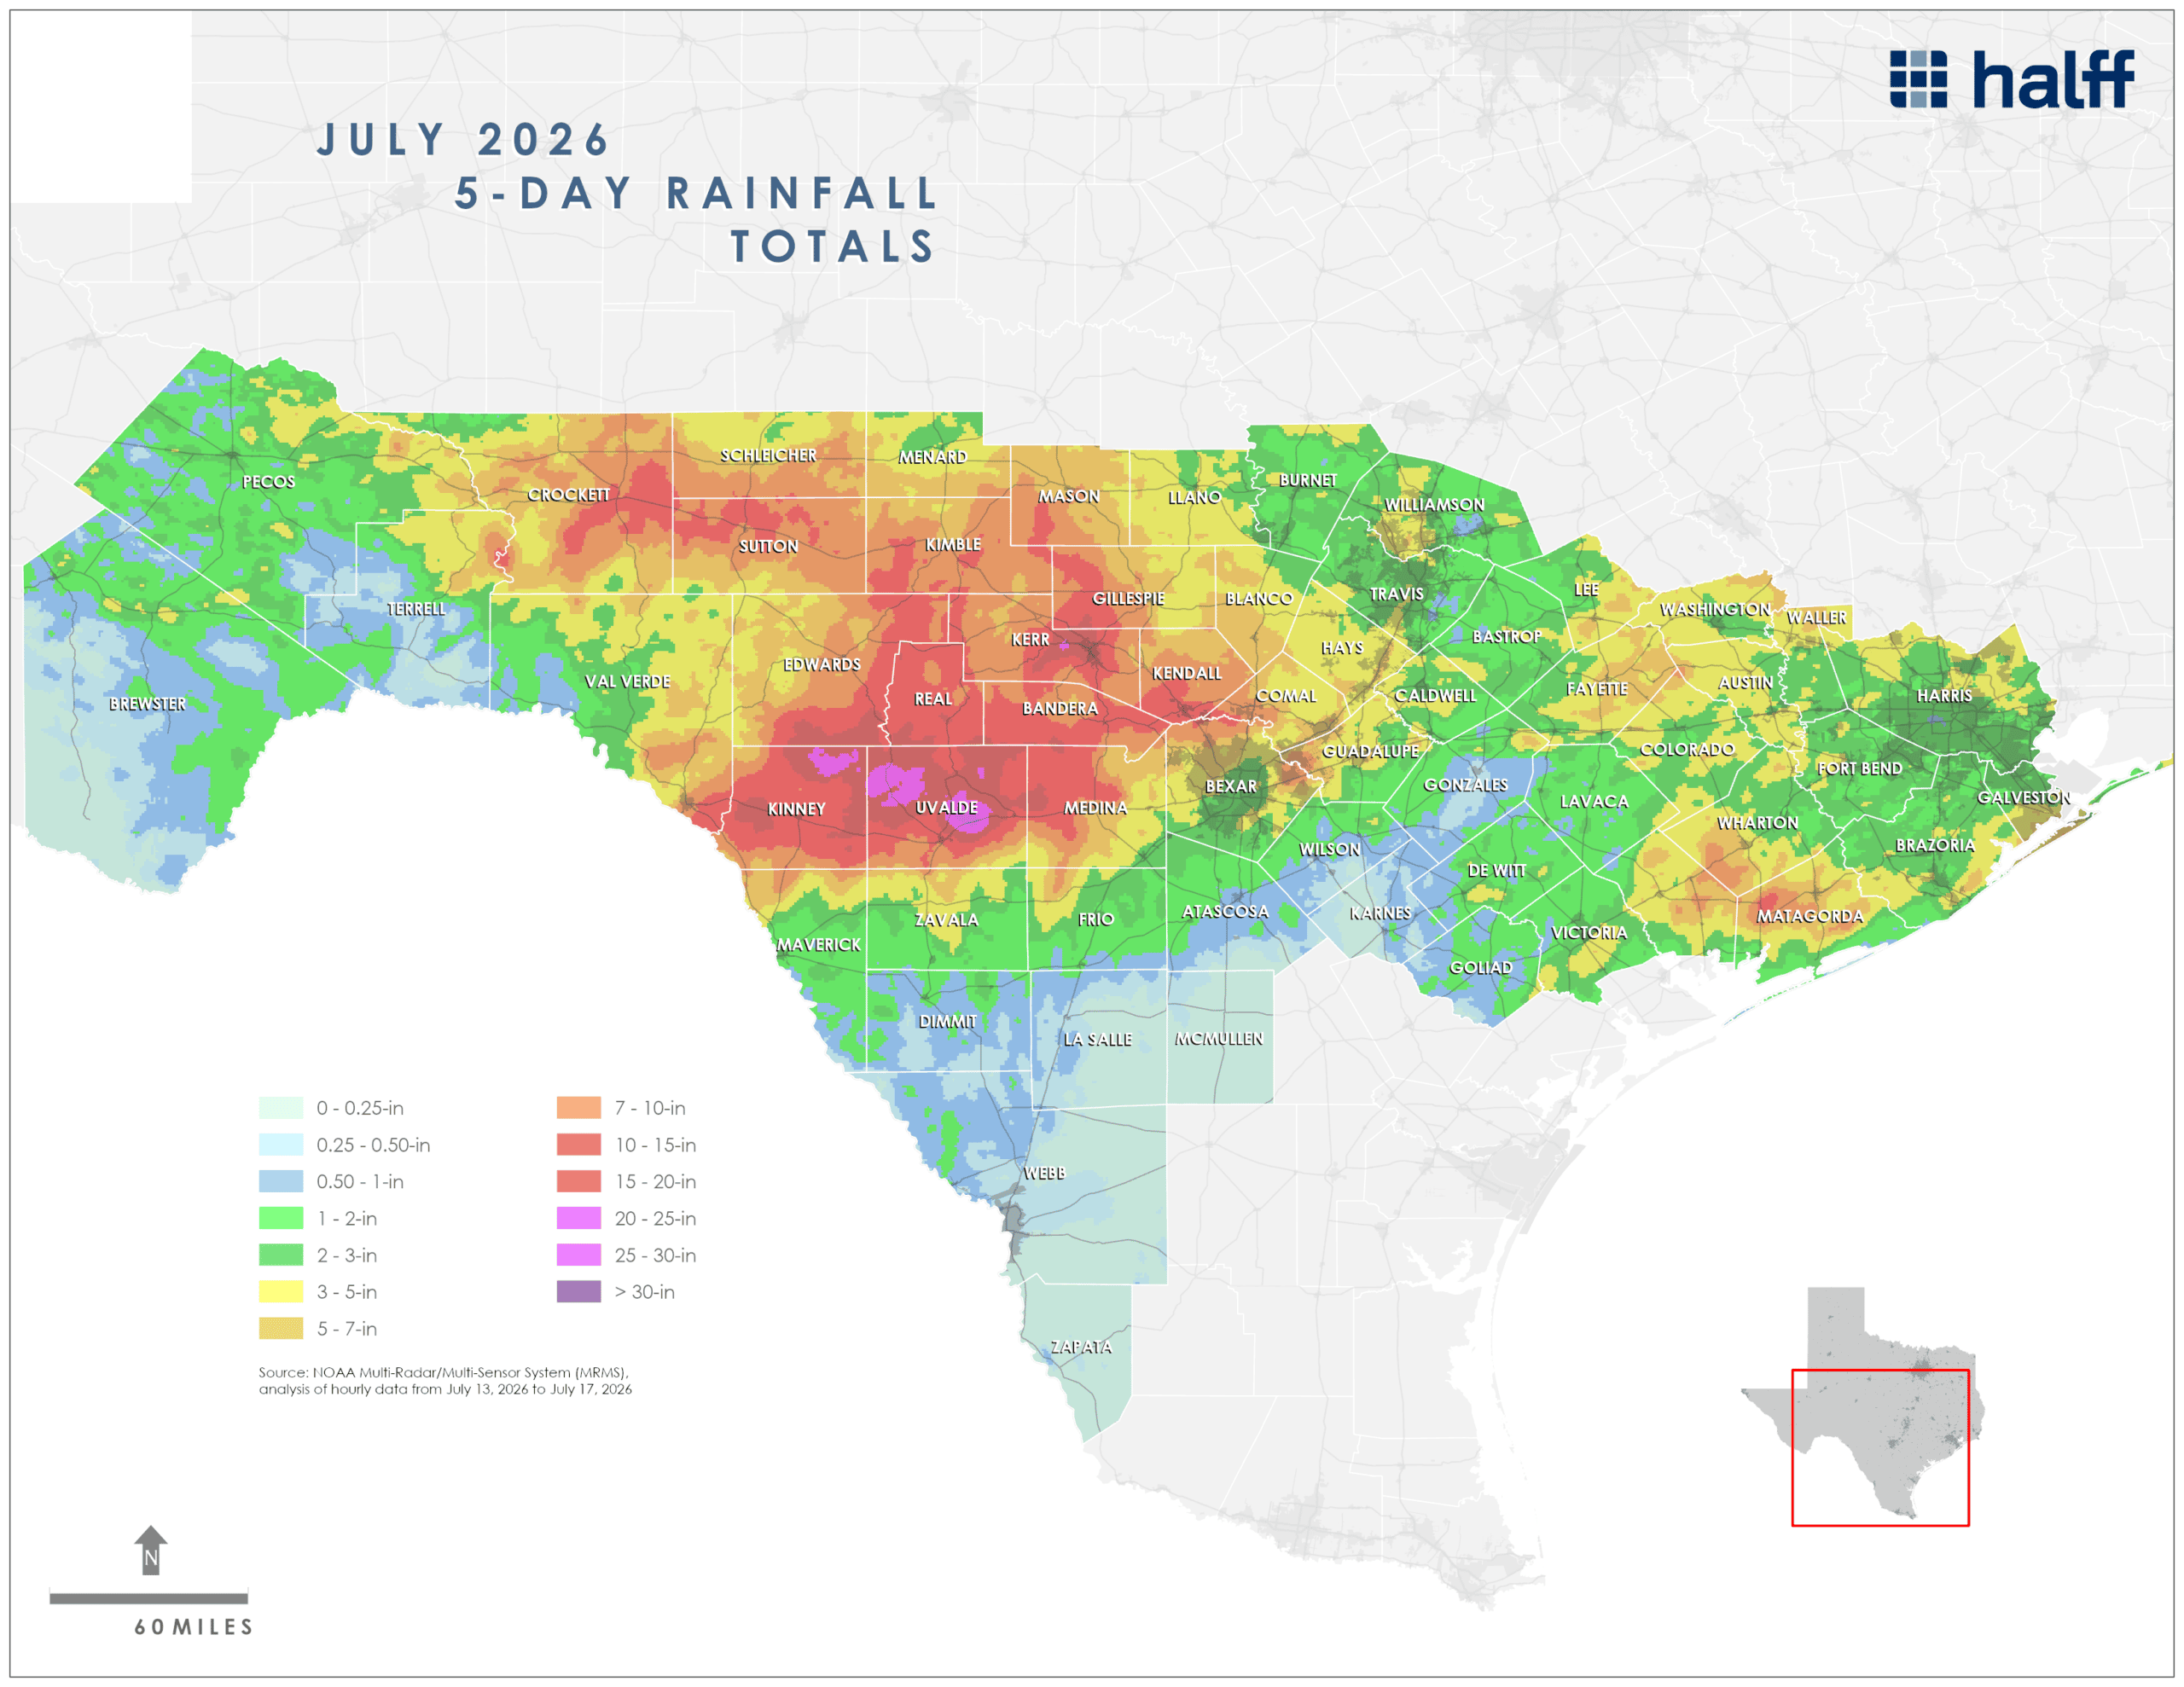
MRMS-based 5-day rainfall totals for the disaster declared counties.
The five-day totals offer another perspective. Parts of Edwards, Kinney and Uvalde counties received rainfall amounts approximately equal to or approaching their typical annual precipitation. Fourteen counties received at least half of their average annual rainfall amounts at isolated locations during this single event.
For a local community, this comparison helps explain why the storm was more than a typical period of heavy rain. For regional and state planners, it provides a common reference point for understanding how the same system affected a broad area unevenly. The maps and charts present the observations; their greater value is helping each audience pull forward the information they need.
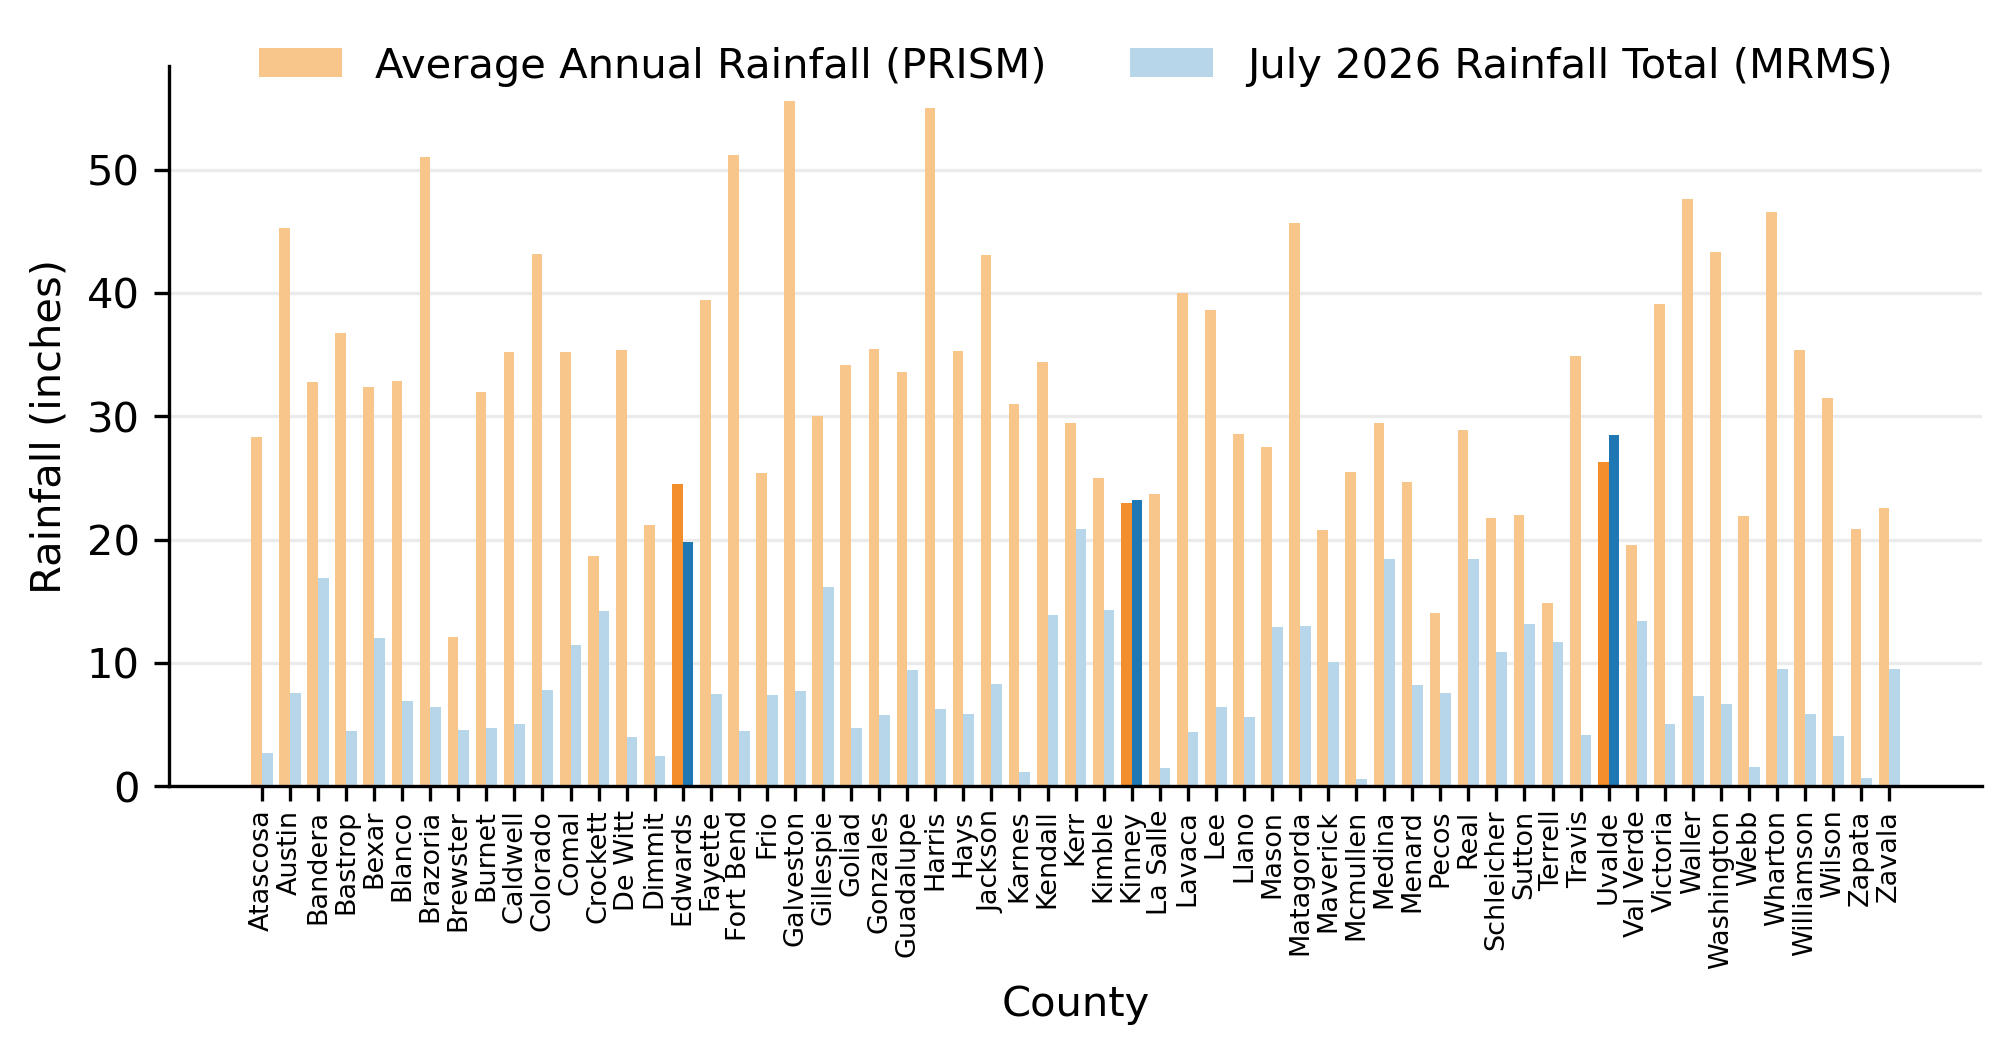
Edwards, Kinney and Uvalde Counties (dark blue) surpassed 80% of the annual rainfall they typically receive.
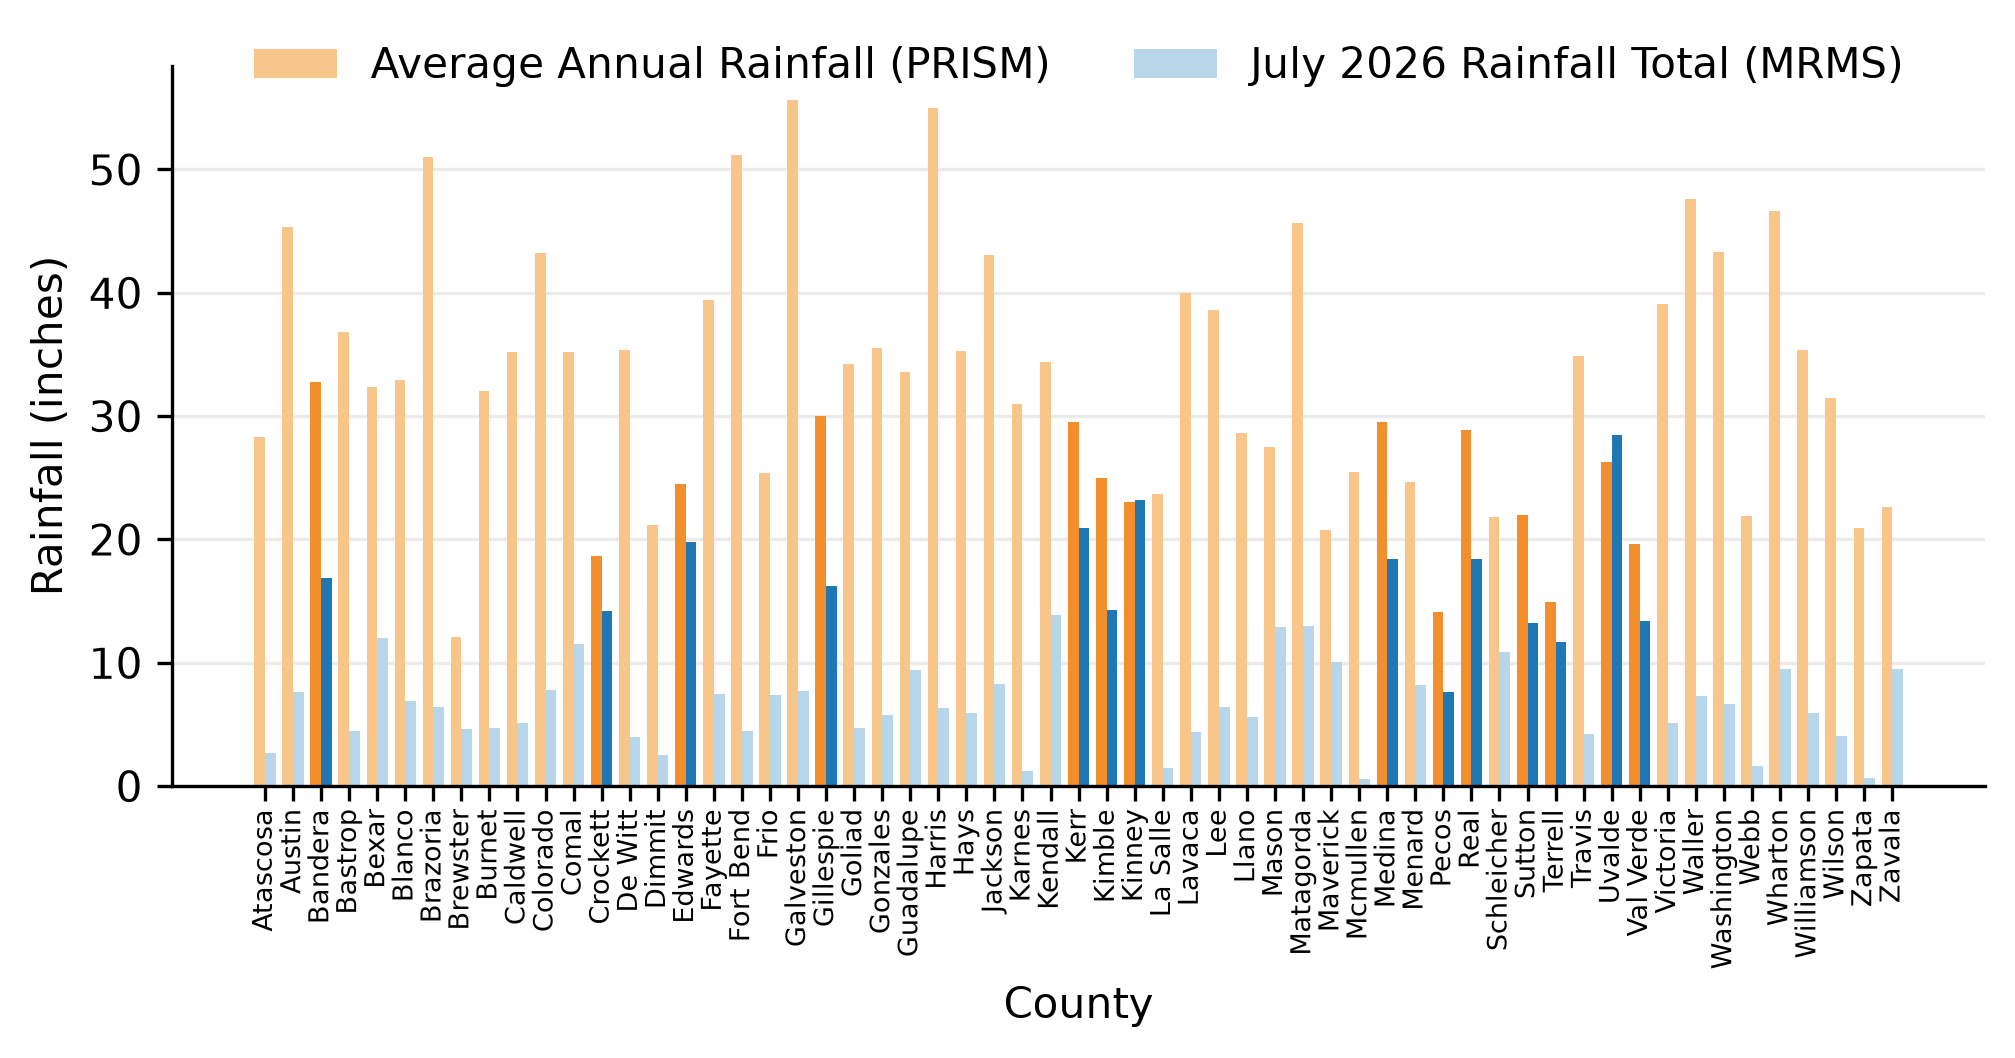
County rainfall totals compared with PRISM-based average annual precipitation show the 14 counties (dark orange and blue bars) that received 50% or more of their annual rainfall amounts.
Stream Gage Observations
Traditional floodplain modeling and mapping typically assume rainfall is distributed uniformly across an entire watershed over a 24-hour period. However, actual storms rarely behave that way because no two storms are alike.
Each rainfall event is different, with timing, location and intensity playing major roles in flood risk. To better understand the resulting flood behavior, Halff evaluated stream gage records across Central Texas.
Of 297 gages assessed between July 10 and Aug. 3, 2026, 19 reached at least moderate flood stage and 22 reached at least major flood stage. This all clearly illustrates the widespread flooding across Central Texas.
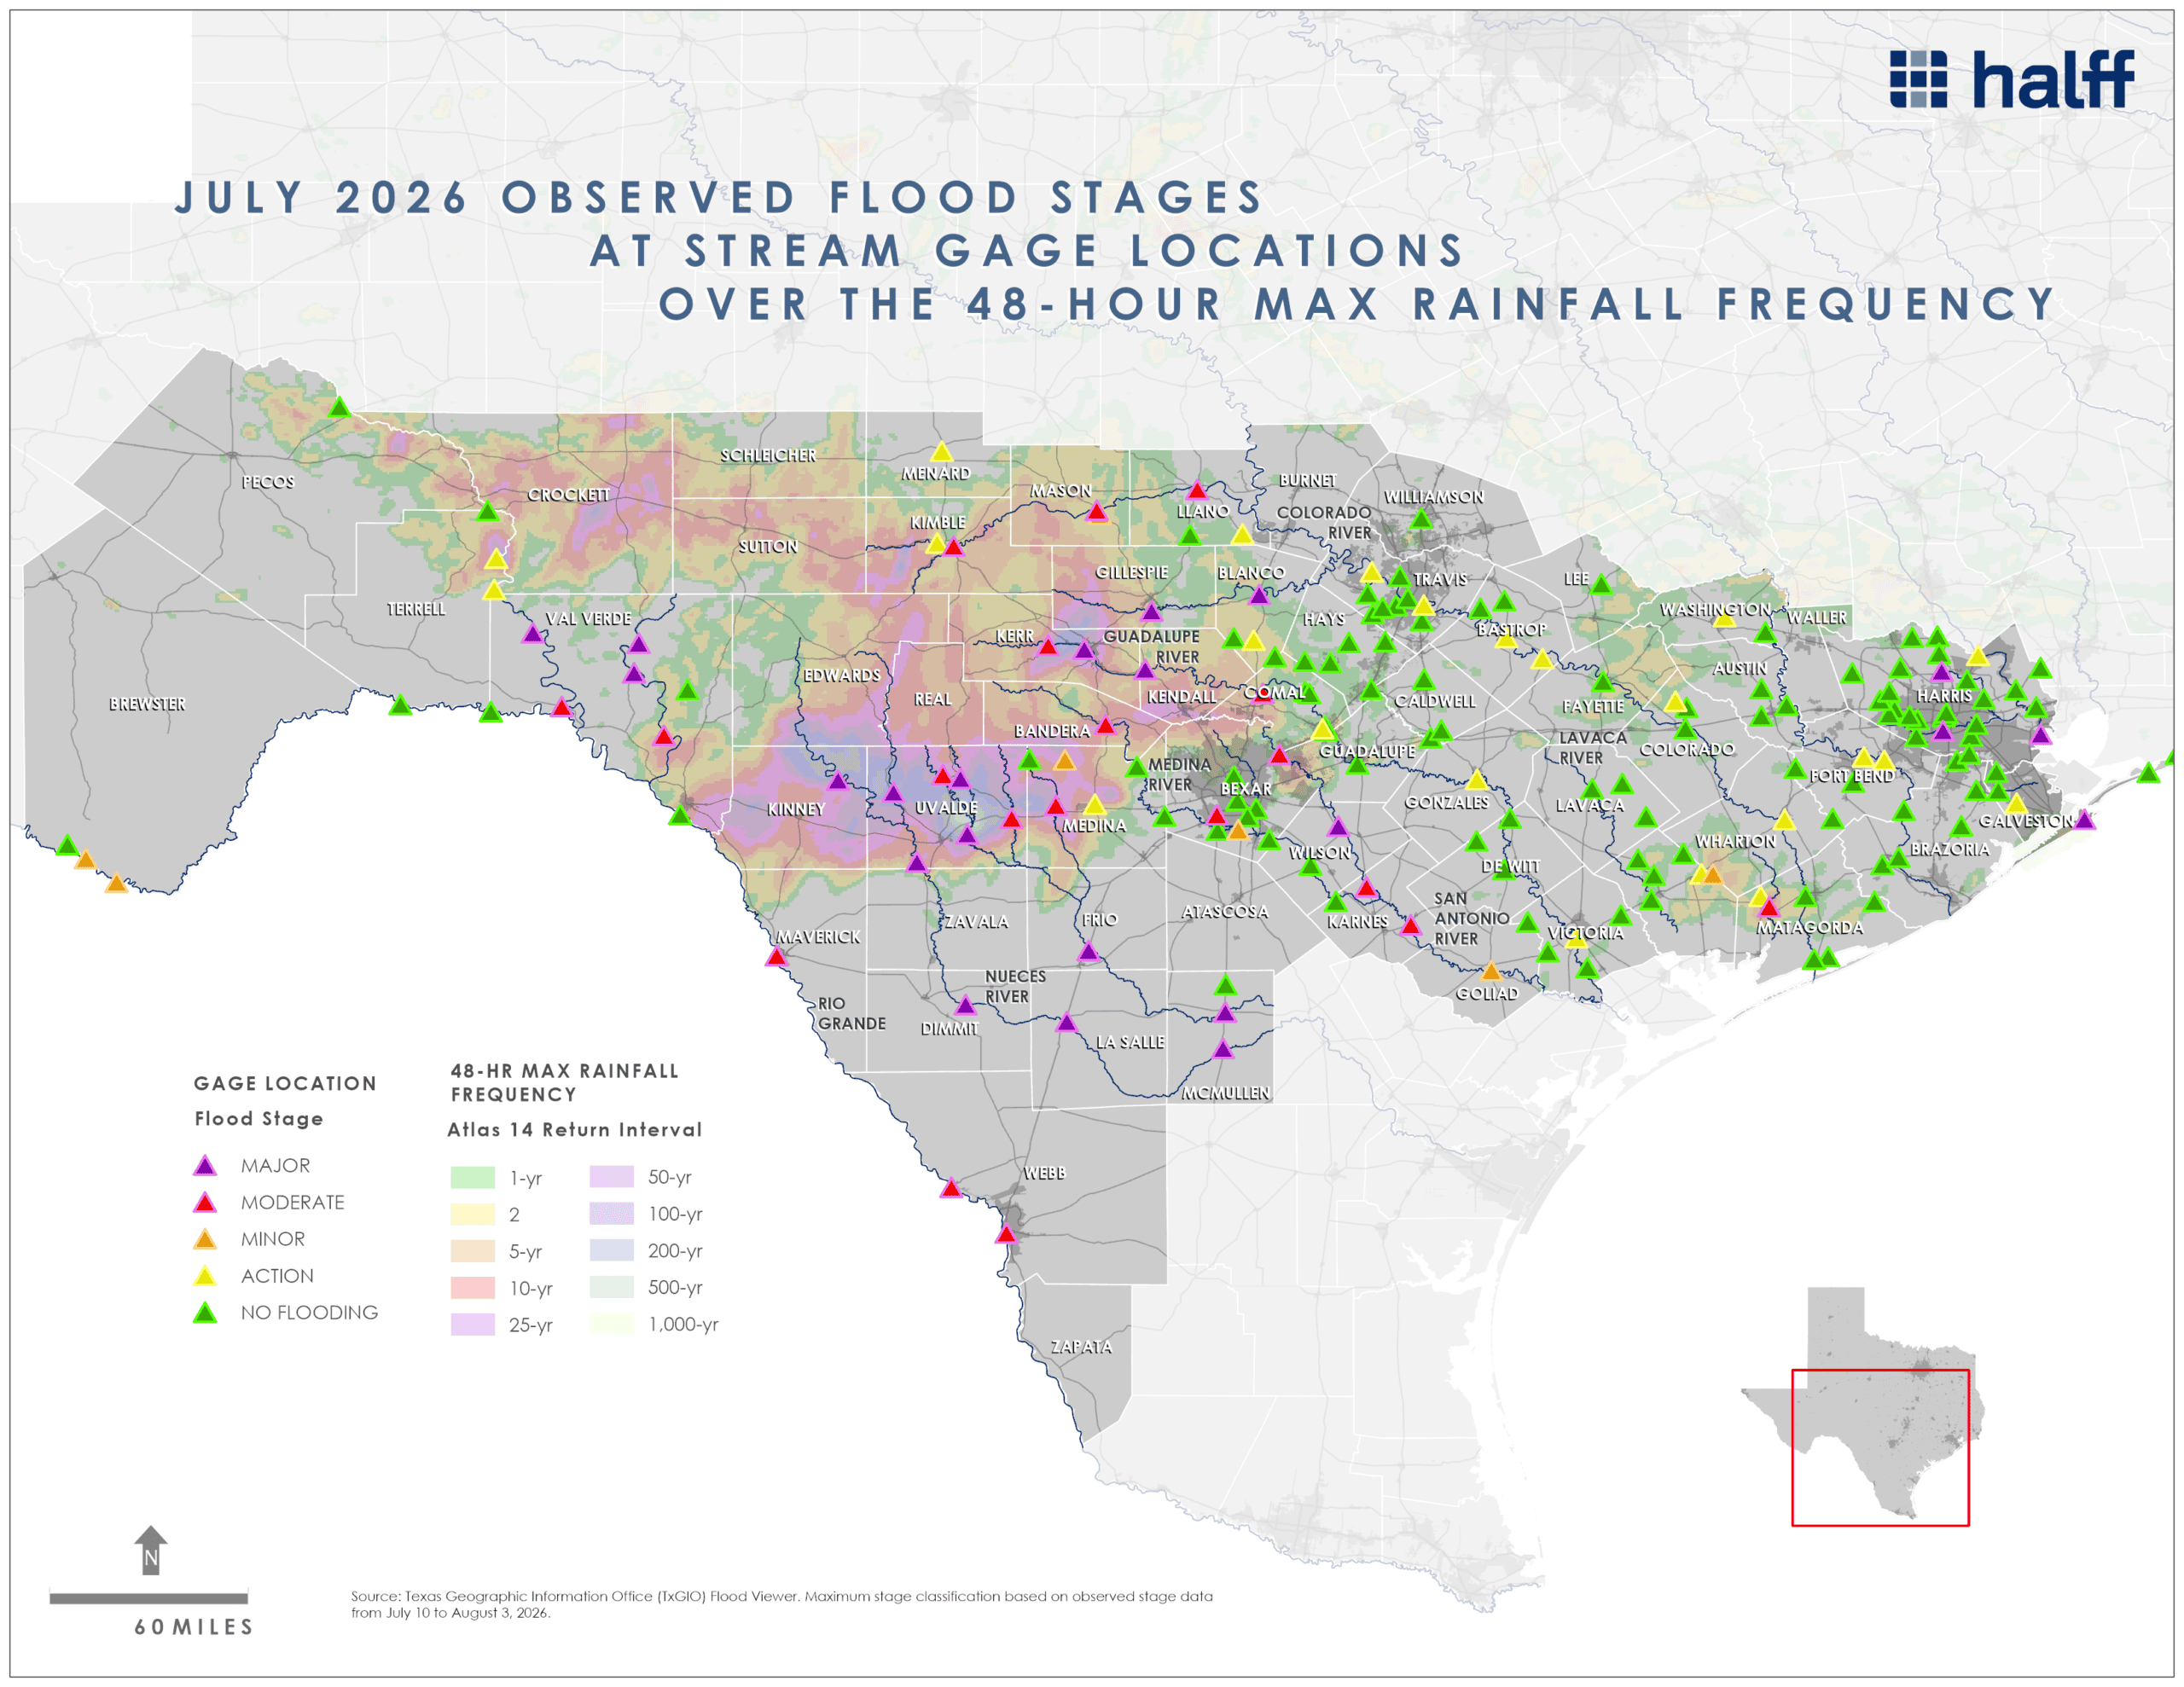
Observed flood stages at TxGIO stream gage locations over the 48-hour maximum rainfall frequency. The dark purple markers show areas that reached a major flood stage.
When reviewing Central Texas U.S. Geological Survey (USGS) stream gage records, peak flood elevations were identified and compared with computed water surface elevations for various frequency events. Many observed gage elevations exceeded FEMA 100-year water surface elevations.
Because several FEMA floodplains in Central Texas have not yet incorporated the latest NOAA Atlas 14 rainfall data, the comparisons shown above are based on computed water surface elevations from newly developed, non-proprietary 2D Base Level Engineering (BLE) models provided by FEMA Region 6 and Texas Water Development Board (TWDB) datasets that includes NOAA Atlas 14 rainfall.
The data clearly shows that 11 gages were near or above the BLE 100-year water surface elevations. These numbers illustrate how this wasn’t a typical heavy rain. The data shows just how extreme the flooding was compared to the area’s usual 100-year flood levels.
One Year’s Worth of Water, All in One Week
Between July 13 and July 18, 2026, this single storm system dumped an estimated 14.8 million acre-feet of rain across the 59-county region. To put that into perspective, Texas consumes nearly 41,600 acre-feet of water per day based on Texas Water Development Board data.
Just six days of rainfall delivered enough water to meet nearly 355 days (almost a full year) of statewide water demand.
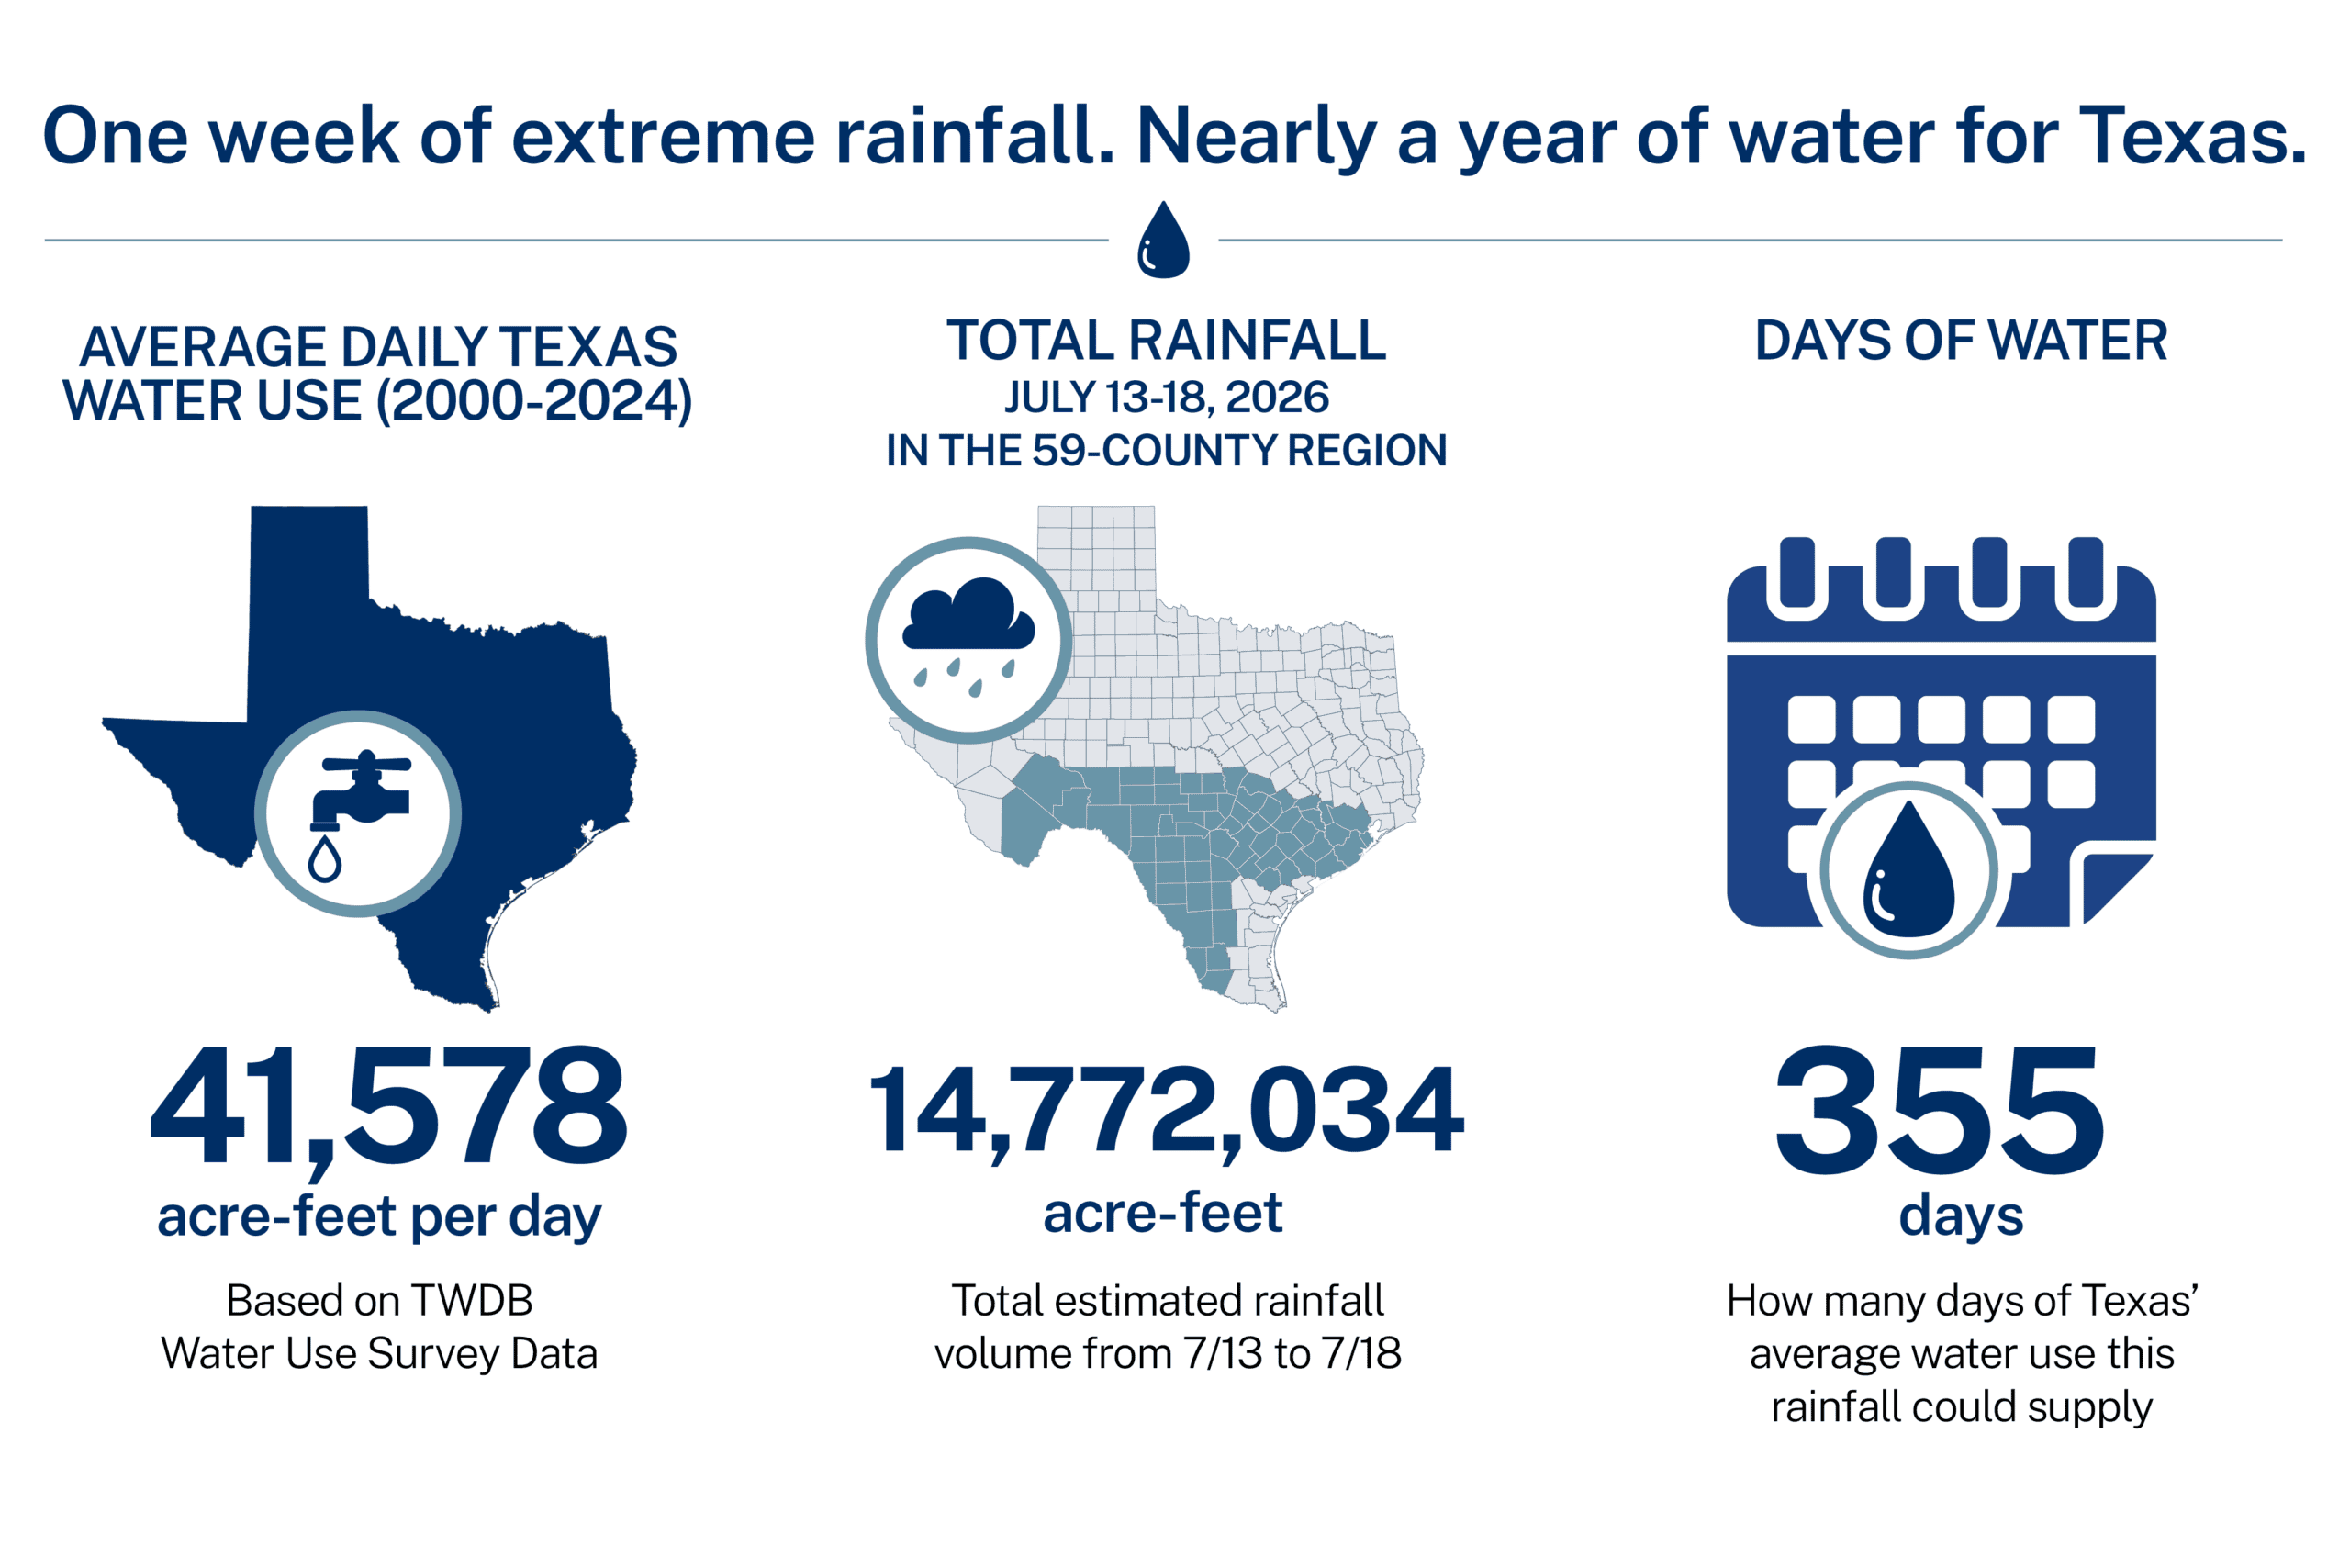
One week of extreme rainfall equated to nearly a year of average water use for Texas.
Not all rainfall becomes usable supply. Before runoff accumulates and finds its way to streams and rivers, a percentage of the rainfall is absorbed into the ground. Some of the runoff is impounded as it makes its way downstream.
The volume of total rainfall still provides important context for water supply managers who may examine how much water moved through a basin, where it traveled and how much reached reservoirs. In the days and weeks after the storm, rivers continued draining toward the coast and contributed inflows to reservoirs such as Lake Corpus Christi which increased from 70,000 acre-feet to more than 230,000 acre-feet, approximately 92% of its capacity.
Even though only a little more than 8% of the total rainfall was captured for water supply, it still amounted to approximately 1,250,000 acre-feet of water. The fact that a small share of the storm’s rainfall yielded such a substantial volume of stored water underscores both the value of existing water infrastructure and the limitations of current systems to capture and retain rainfall from major storm events.
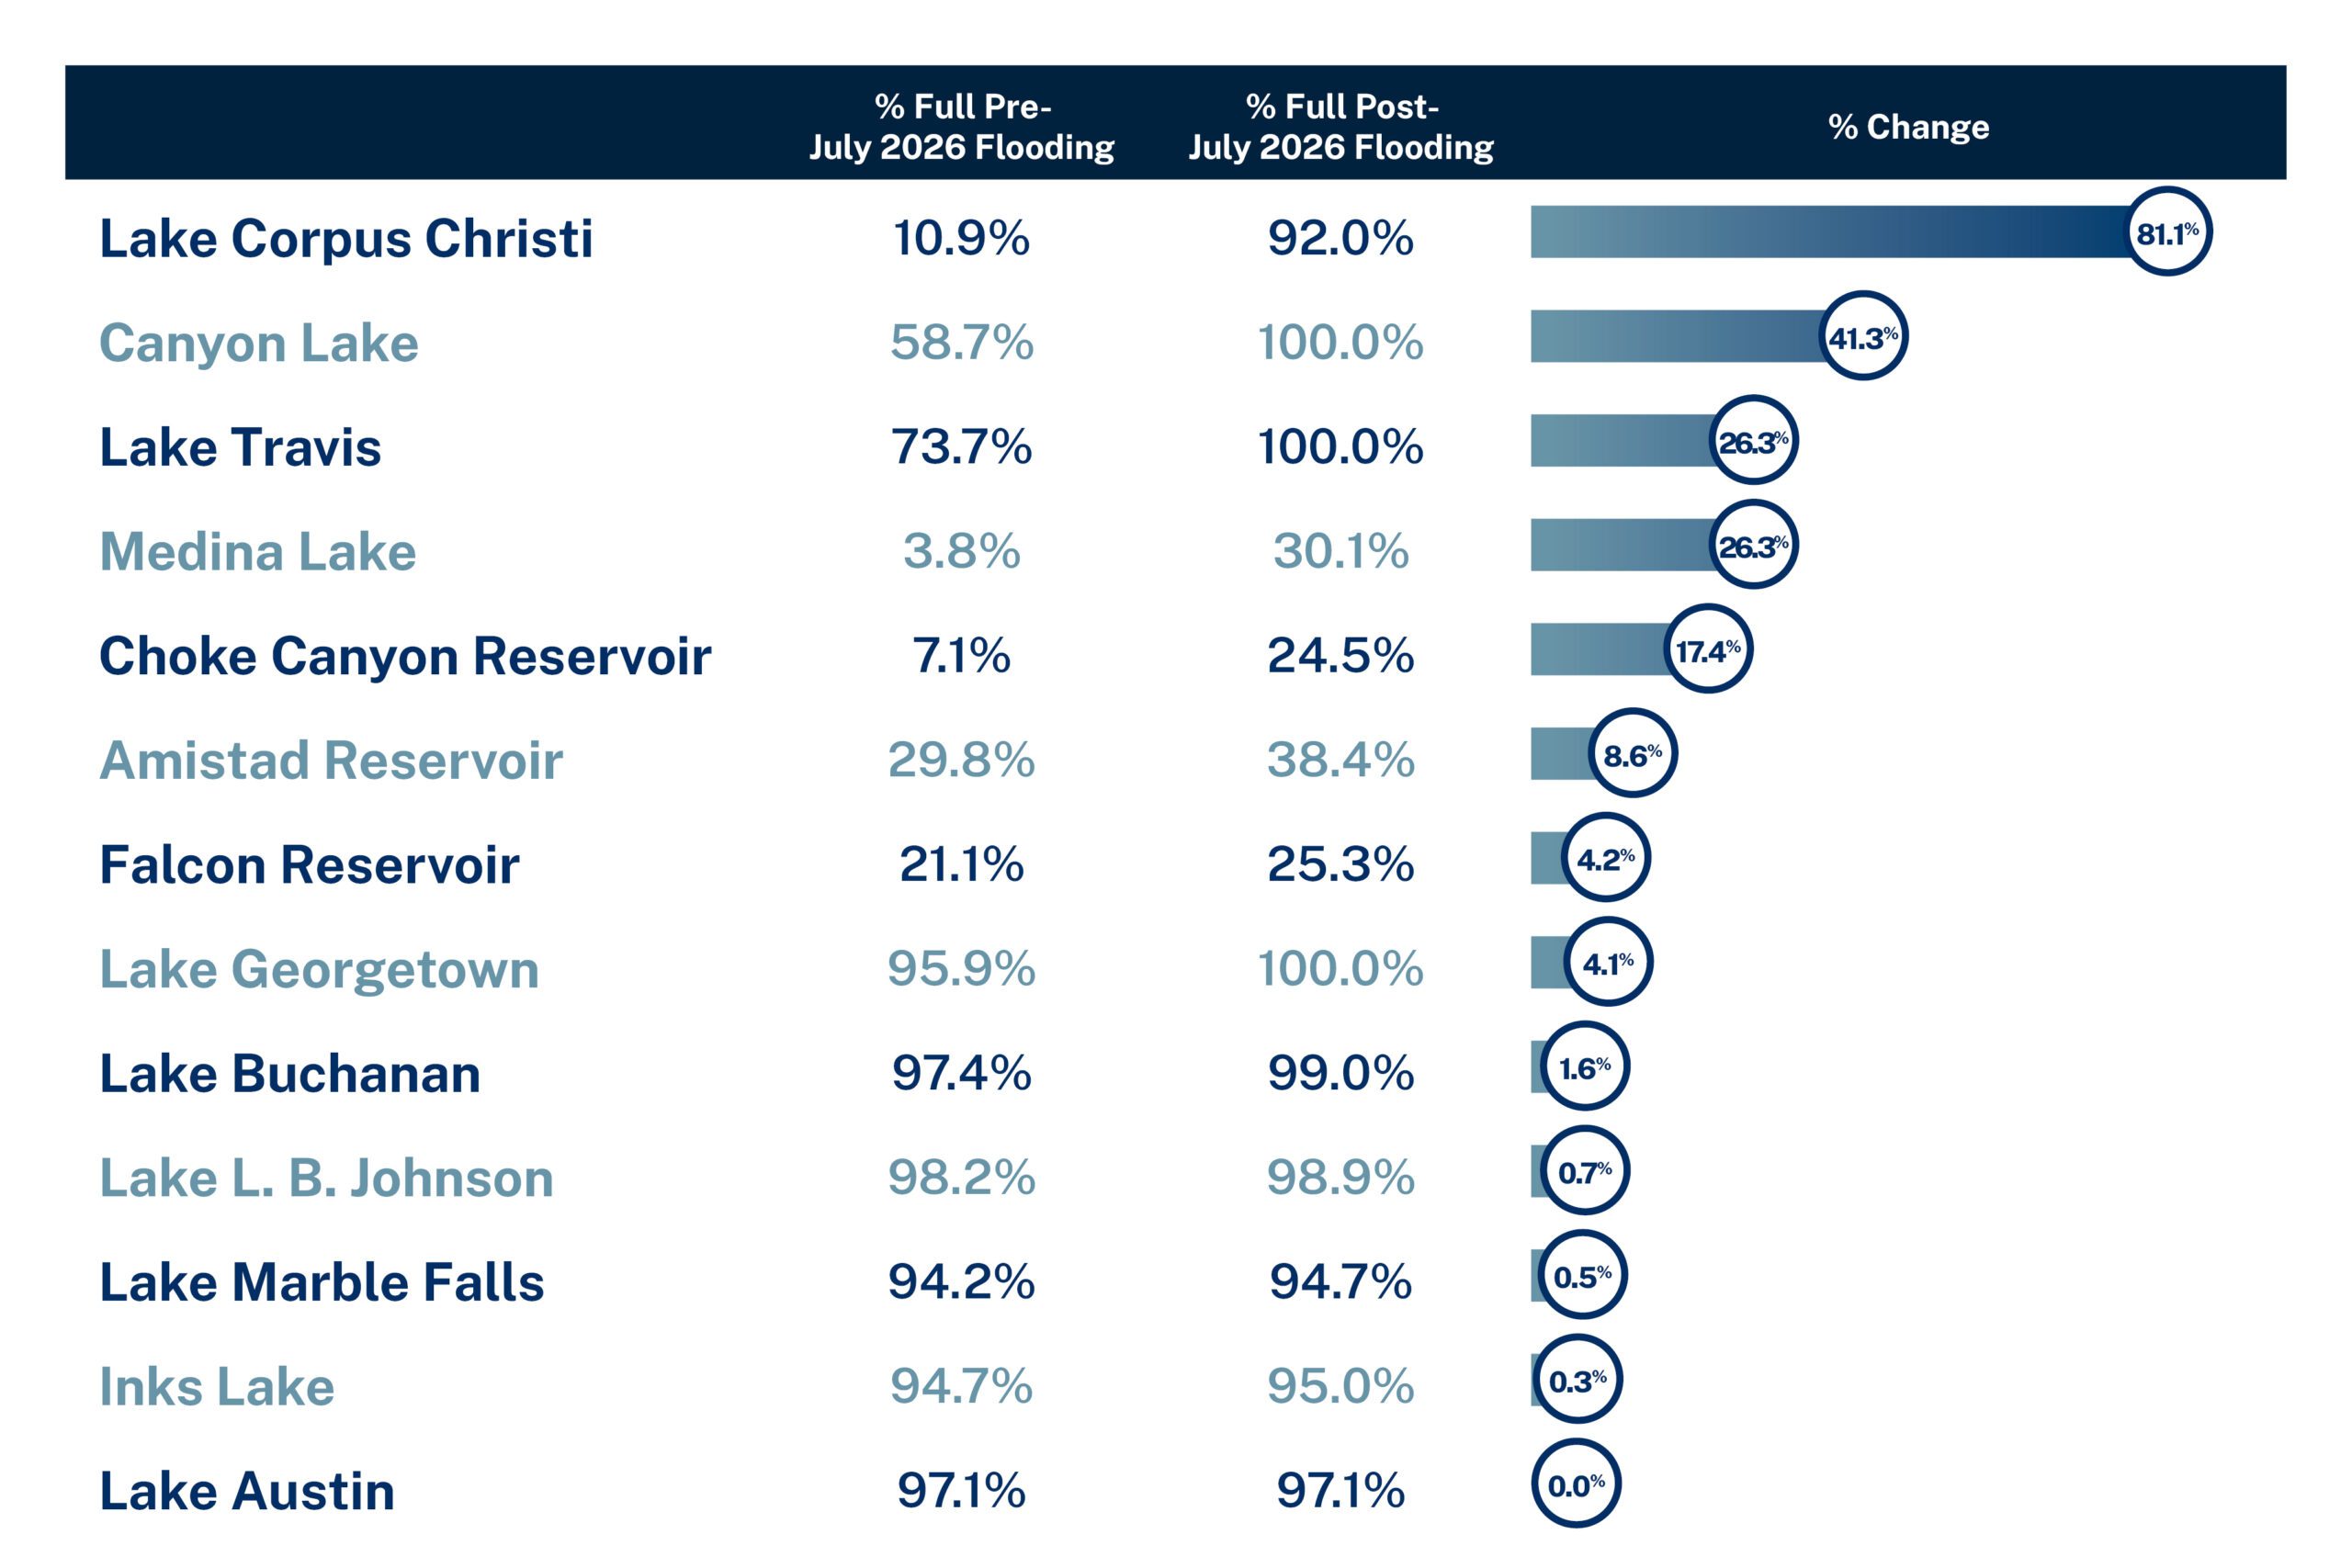
Data source: https://www.waterdatafortexas.org/reservoirs/statewide
For emergency response, the total volume may be less critical than the location and duration of flooding. For water planning, though, it helps frame the storm as part of a larger water resources system.
Yesterday’s Data, Tomorrow’s Readiness
From the July 2026 storm, it was possible to gather a wide range of information, from rainfall totals and frequencies, flood stages and water surface elevations to estimated volumes and downstream reservoir inflows. Together, these findings provide a shared account of the event that agencies, communities and water professionals alike can use to better understand what happened and inform future planning, flood resilience, response and recovery efforts.
The storm also reinforces the need to view water from more than one perspective. While it created dangerous flooding in some areas, some of the water moved downstream, contributing to reservoir storage for another part of the state in the following weeks. Flood management and water supply planning may ask different questions, but both rely on understanding how rainfall, runoff and systems interact holistically.
Texas has invested in extensive public models and datasets, but their greatest value comes when that information is translated into a form multiple parties can use. By doing so, Halff’s analysis offers a practical resource for understanding what happened and how to prepare for what comes next, before the next storm.
Recent Stories

Phoenix on the Rise: Building for What’s Next with Halff’s Pete Hemingway
Peter Hemingway is Halff’s Phoenix public works director, helping to expand the firm’s expertise in Arizona. When Peter Hemingway first…

Federal Design-Build Moves Fast. Is Your Design Partner Helping or Holding You Back?
Federal contractors are being asked to do more than ever before. Agencies want aging facilities and infrastructure replaced more quickly….